- Published on
Ultimate Guide: Make A Stock Chart with AlpineJS and ChartsJS With Tailwind CSS
- What is Tailwind CSS?
- The description of Stock Chart with AlpineJS and ChartsJS ui component
- Why use Tailwind CSS to create a Stock Chart with AlpineJS and ChartsJS ui component?
- The preview of Stock Chart with AlpineJS and ChartsJS ui component.
- The source code of Stock Chart with AlpineJS and ChartsJS ui component.
- How to create a Stock Chart with AlpineJS and ChartsJS with Tailwind CSS?
- Conclusion
Are you looking to create a stunning stock chart for your website or application? Look no further than AlpineJS and ChartsJS with Tailwind CSS. In this ultimate guide, we will walk you through the process of creating a stock chart using these powerful tools.
What is Tailwind CSS?
Tailwind CSS is a utility-first CSS framework that allows you to rapidly build custom user interfaces. It provides a set of pre-defined CSS classes that you can use to style your HTML elements. With Tailwind CSS, you can easily create responsive designs and customize your styles to fit your specific needs.
The description of Stock Chart with AlpineJS and ChartsJS ui component
AlpineJS is a lightweight JavaScript framework that allows you to create dynamic web applications with minimal setup. It provides a set of directives that you can use to bind data to your HTML elements and create interactive user interfaces.
ChartsJS is a popular JavaScript library for creating beautiful charts and graphs. It provides a wide range of chart types and customization options, making it a great choice for creating stock charts.
Together, AlpineJS and ChartsJS provide a powerful combination for creating dynamic and interactive stock charts.
Why use Tailwind CSS to create a Stock Chart with AlpineJS and ChartsJS ui component?
Tailwind CSS provides a set of pre-defined CSS classes that you can use to style your HTML elements. This makes it easy to create a consistent and professional-looking design for your stock chart. Additionally, Tailwind CSS provides responsive design classes that allow you to create a chart that looks great on any device.
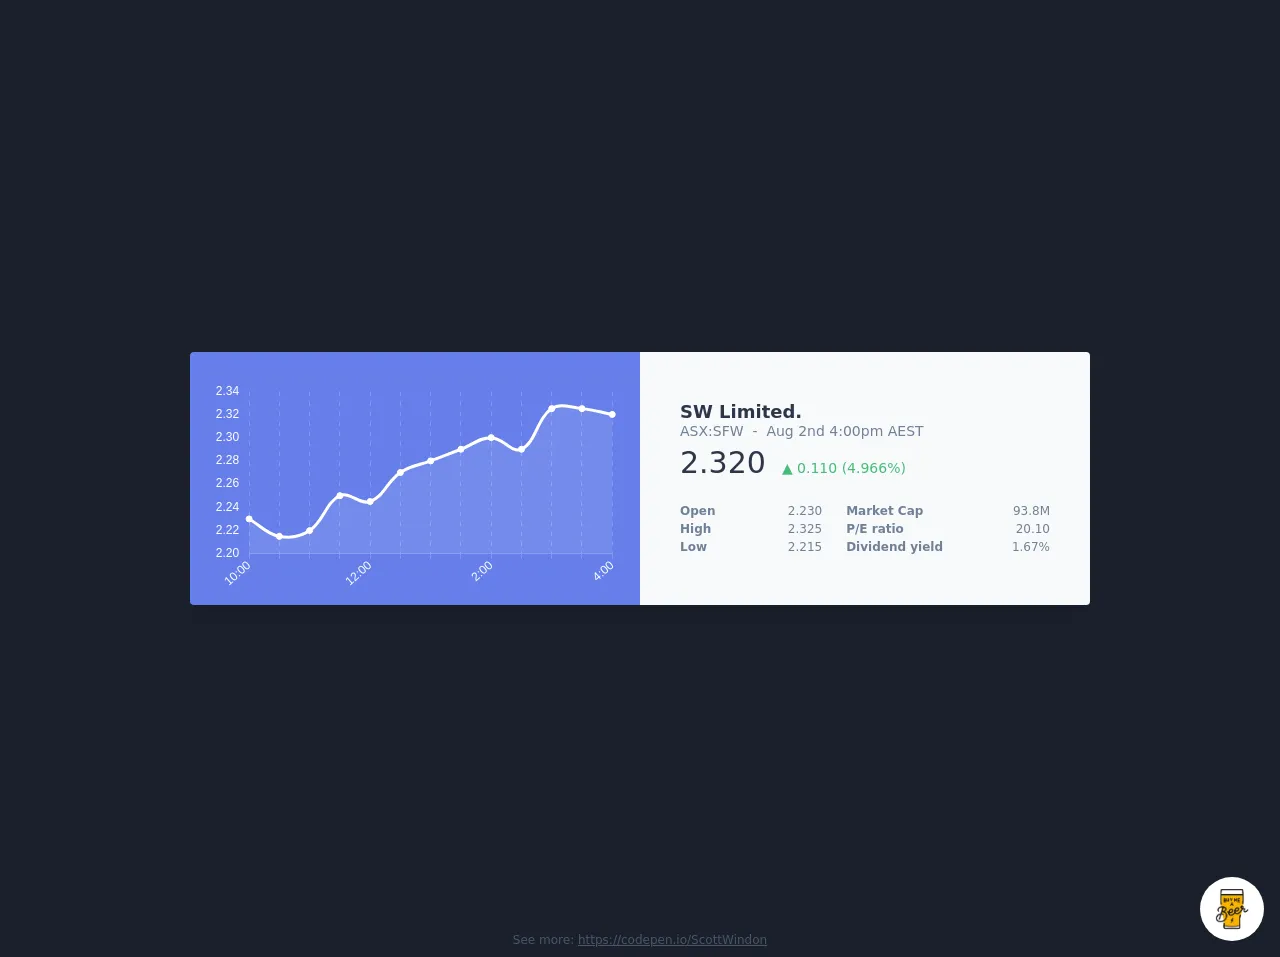
The preview of Stock Chart with AlpineJS and ChartsJS ui component.
To create a stock chart with AlpineJS and ChartsJS, we will be using the following components:
- AlpineJS
- ChartsJS
- Tailwind CSS
Free download of the Stock Chart with AlpineJS and ChartsJS's source code
The source code of Stock Chart with AlpineJS and ChartsJS ui component.
To create a stock chart with AlpineJS and ChartsJS, you will need to include the following libraries in your HTML file:
<!-- AlpineJS -->
<script src="https://cdn.jsdelivr.net/npm/[email protected]/dist/alpine.js"></script>

<!-- ChartsJS -->
<script src="https://cdn.jsdelivr.net/npm/[email protected]/dist/chart.min.js"></script>
You will also need to include the following CSS file for Tailwind CSS:
<!-- Tailwind CSS -->
<link href="https://cdn.jsdelivr.net/npm/[email protected]/dist/tailwind.min.css" rel="stylesheet">
<script src="https://cdn.jsdelivr.net/gh/alpinejs/[email protected]/dist/alpine.js" defer></script>
<script src="https://cdnjs.cloudflare.com/ajax/libs/Chart.js/2.9.3/Chart.min.js"></script>
<div class="min-w-screen min-h-screen bg-gray-900 flex items-center justify-center px-5 py-5">
<div class="rounded shadow-xl overflow-hidden w-full md:flex" style="max-width:900px" x-data="{stockTicker:stockTicker()}" x-init="stockTicker.renderChart()">
<div class="flex w-full md:w-1/2 px-5 pb-4 pt-8 bg-indigo-500 text-white items-center">
<canvas id="chart" class="w-full"></canvas>
</div>
<div class="flex w-full md:w-1/2 p-10 bg-gray-100 text-gray-600 items-center">
<div class="w-full">
<h3 class="text-lg font-semibold leading-tight text-gray-800" x-text="stockTicker.stockFullName"></h3>
<h6 class="text-sm leading-tight mb-2"><span x-text="stockTicker.stockShortName"></span> - Aug 2nd 4:00pm AEST</h6>
<div class="flex w-full items-end mb-6">
<span class="block leading-none text-3xl text-gray-800" x-text="stockTicker.price.current.toFixed(3)">0</span>
<span class="block leading-5 text-sm ml-4 text-green-500" x-text="`${stockTicker.price.high-stockTicker.price.low<0?'▼':'▲'} ${(stockTicker.price.high-stockTicker.price.low).toFixed(3)} (${(((stockTicker.price.high/stockTicker.price.low)*100)-100).toFixed(3)}%)`"></span>
</div>
<div class="flex w-full text-xs">
<div class="flex w-5/12">
<div class="flex-1 pr-3 text-left font-semibold">Open</div>
<div class="flex-1 px-3 text-right" x-text="stockTicker.price.open.toFixed(3)">0</div>
</div>
<div class="flex w-7/12">
<div class="flex-1 px-3 text-left font-semibold">Market Cap</div>
<div class="flex-1 pl-3 text-right" x-text="stockTicker.price.cap.m_formatter()">0</div>
</div>
</div>
<div class="flex w-full text-xs">
<div class="flex w-5/12">
<div class="flex-1 pr-3 text-left font-semibold">High</div>
<div class="px-3 text-right" x-text="stockTicker.price.high.toFixed(3)">0</div>
</div>
<div class="flex w-7/12">
<div class="flex-1 px-3 text-left font-semibold">P/E ratio</div>
<div class="pl-3 text-right" x-text="stockTicker.price.ratio.toFixed(2)">0</div>
</div>
</div>
<div class="flex w-full text-xs">
<div class="flex w-5/12">
<div class="flex-1 pr-3 text-left font-semibold">Low</div>
<div class="px-3 text-right" x-text="stockTicker.price.low.toFixed(3)">0</div>
</div>
<div class="flex w-7/12">
<div class="flex-1 px-3 text-left font-semibold">Dividend yield</div>
<div class="pl-3 text-right" x-text="`${stockTicker.price.dividend}%`">0%</div>
</div>
</div>
</div>
</div>
</div>
</div>
<div class="absolute bottom-0 pb-2 text-gray-700 text-xs w-full text-center">
See more: <a href="https://codepen.io/ScottWindon" class="underline hover:text-gray-500" target="_blank">https://codepen.io/ScottWindon</a>
</div>
<script>
Number.prototype.m_formatter = function() {
return this > 999999 ? (this / 1000000).toFixed(1) + 'M' : this
};
let stockTicker = function(){
return {
stockFullName: 'SW Limited.',
stockShortName: 'ASX:SFW',
price: {
current: 2.320,
open: 2.230,
low: 2.215,
high: 2.325,
cap: 93765011,
ratio: 20.10,
dividend: 1.67
},
chartData: {
labels: ['10:00','','','','12:00','','','','2:00','','','','4:00'],
data: [2.23,2.215,2.22,2.25,2.245,2.27,2.28,2.29,2.3,2.29,2.325,2.325,2.32],
},
renderChart: function(){
let c = false;
Chart.helpers.each(Chart.instances, function(instance) {
if (instance.chart.canvas.id == 'chart') {
c = instance;
}
});
if(c) {
c.destroy();
}
let ctx = document.getElementById('chart').getContext('2d');
let chart = new Chart(ctx, {
type: "line",
data: {
labels: this.chartData.labels,
datasets: [
{
label: '',
backgroundColor: "rgba(255, 255, 255, 0.1)",
borderColor: "rgba(255, 255, 255, 1)",
pointBackgroundColor: "rgba(255, 255, 255, 1)",
data: this.chartData.data,
},
],
},
layout: {
padding: {
right: 10
}
},
options: {
legend: {
display: false,
},
scales: {
yAxes: [{
ticks: {
fontColor: "rgba(255, 255, 255, 1)",
},
gridLines: {
display: false,
},
}],
xAxes: [{
ticks: {
fontColor: "rgba(255, 255, 255, 1)",
},
gridLines: {
color: "rgba(255, 255, 255, .2)",
borderDash: [5, 5],
zeroLineColor: "rgba(255, 255, 255, .2)",
zeroLineBorderDash: [5, 5]
},
}]
}
}
});
}
}
}
</script>
<!-- BUY ME A BEER AND HELP SUPPORT OPEN-SOURCE RESOURCES -->
<div class="flex items-end justify-end fixed bottom-0 right-0 mb-4 mr-4 z-10">
<div>
<a title="Buy me a beer" href="https://www.buymeacoffee.com/scottwindon" target="_blank" class="block w-16 h-16 rounded-full transition-all shadow hover:shadow-lg transform hover:scale-110 hover:rotate-12">
<img class="object-cover object-center w-full h-full rounded-full" src="https://i.pinimg.com/originals/60/fd/e8/60fde811b6be57094e0abc69d9c2622a.jpg"/>
</a>
</div>
</div>
How to create a Stock Chart with AlpineJS and ChartsJS with Tailwind CSS?
Now that we have our libraries and CSS files set up, we can begin creating our stock chart.
First, we will create our HTML structure for the chart:
<div class="bg-white rounded-lg shadow-md p-6">
  <canvas id="myChart" width="400" height="400"></canvas>
</div>
This creates a container for our chart with a white background, rounded corners, and a shadow effect. Inside the container, we have a canvas element with an ID of "myChart". This is where our chart will be rendered.
Next, we will create our AlpineJS component:
<div x-data="chartData()">
  <div class="bg-white rounded-lg shadow-md p-6">
    <canvas id="myChart" width="400" height="400"></canvas>
  </div>
</div>

<script>
  function chartData() {
    return {
      chart: null,
      data: {
        labels: ['January', 'February', 'March', 'April', 'May', 'June', 'July'],
        datasets: [{
          label: 'Stock Price',
          backgroundColor: 'rgba(255, 99, 132, 0.2)',
          borderColor: 'rgba(255, 99, 132, 1)',
          borderWidth: 1,
          data: [65, 59, 80, 81, 56, 55, 40]
        }]
      },
      options: {
        responsive: true,
        maintainAspectRatio: false,
        scales: {
          yAxes: [{
            ticks: {
              beginAtZero: true
            }
          }]
        }
      },
      init() {
        this.chart = new Chart(document.getElementById('myChart'), {
          type: 'line',
          data: this.data,
          options: this.options
        });
      }
    }
  }
</script>
This creates an AlpineJS component with a data object that contains our chart data, options, and an init function that creates our chart using ChartsJS.
Finally, we will add some styles to our chart using Tailwind CSS:
<div x-data="chartData()">
  <div class="bg-white rounded-lg shadow-md p-6">
    <canvas id="myChart" class="w-full h-full"></canvas>
  </div>
</div>

<style>
  #myChart {
    max-height: 400px;
  }
</style>
This sets the width and height of our chart to 100% of its container and sets a maximum height of 400 pixels. We also add some padding and a border radius to our container to give it a more polished look.
Conclusion
Creating a stock chart with AlpineJS and ChartsJS with Tailwind CSS is a powerful combination that allows you to create dynamic and interactive charts with ease. By following the steps outlined in this guide, you can create a stunning stock chart for your website or application in no time.