- Published on
Surprisingly Effective Ways To Create A Dashboard Statistic Widgets With Tailwind CSS
- What is Tailwind CSS?
- The description of Dashboard Statistic Widgets UI component
- Why use Tailwind CSS to create a Dashboard Statistic Widgets UI component?
- The preview of Dashboard Statistic Widgets UI component
- The source code of Dashboard Statistic Widgets UI component
- How to create a Dashboard Statistic Widgets with Tailwind CSS?
- Conclusion
What is Tailwind CSS?
Tailwind CSS is a utility-first CSS framework that allows developers to quickly create custom designs without writing any CSS code. It provides a set of pre-defined classes that can be used to style HTML elements. Tailwind CSS is highly customizable and can be used to create responsive designs for different screen sizes.
The description of Dashboard Statistic Widgets UI component
A Dashboard Statistic Widgets UI component is a set of widgets that display important statistics and data on a dashboard. These widgets are usually displayed in a grid layout and can be customized to display different types of data. The Dashboard Statistic Widgets UI component is commonly used in web applications and dashboards to provide users with a quick overview of important data.
Why use Tailwind CSS to create a Dashboard Statistic Widgets UI component?
Tailwind CSS is an excellent choice for creating a Dashboard Statistic Widgets UI component because it provides a set of pre-defined classes that can be used to style the widgets. This saves developers a lot of time and effort as they don't have to write any CSS code from scratch. Tailwind CSS also provides a responsive grid system that makes it easy to create a grid layout for the widgets.
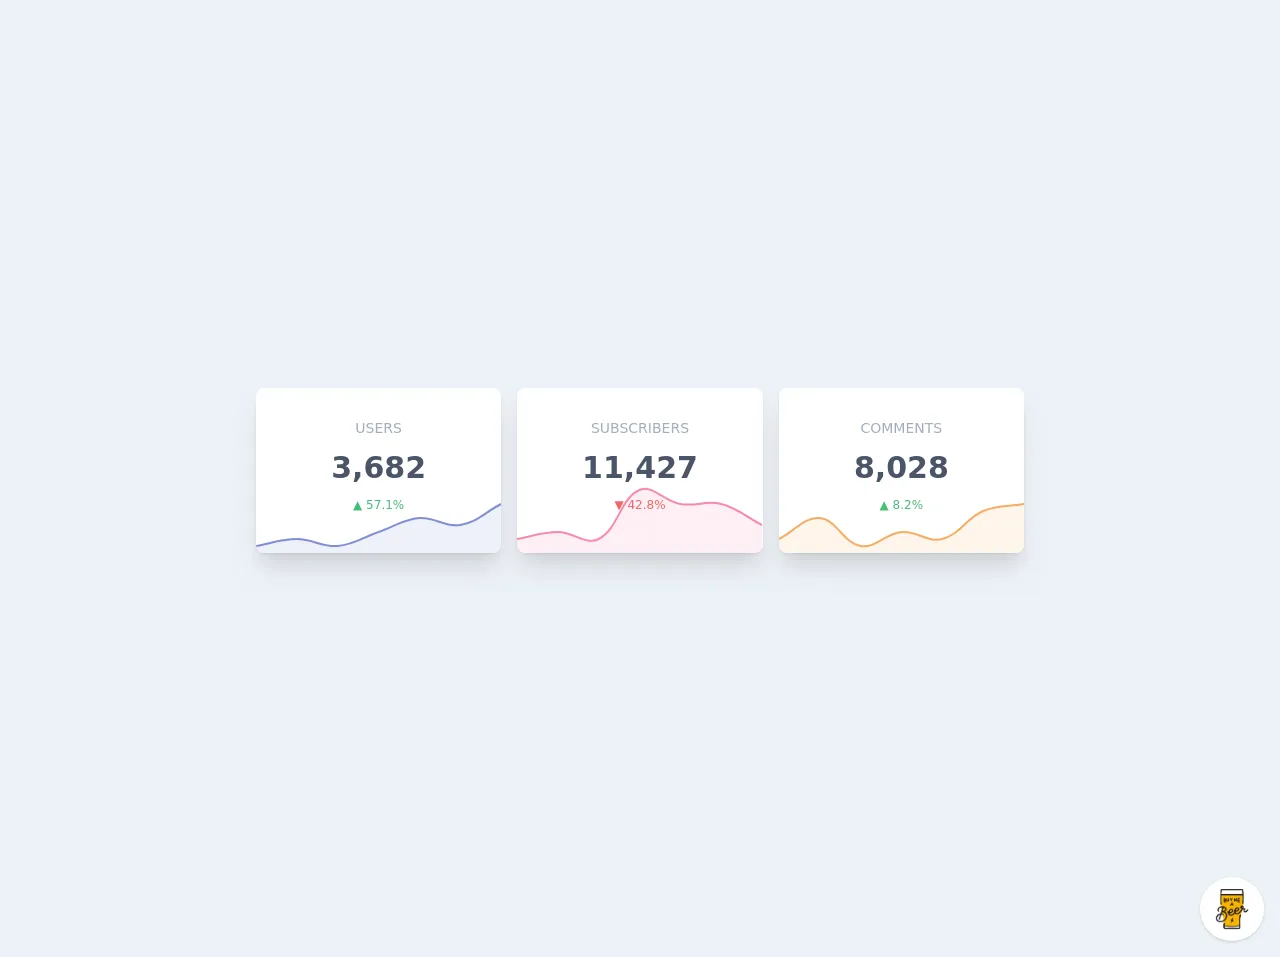
The preview of Dashboard Statistic Widgets UI component
The Dashboard Statistic Widgets UI component consists of several widgets that display important data. These widgets are usually displayed in a grid layout and can be customized to display different types of data.
Free download of the Dashboard Statistic Widgets's source code
The source code of Dashboard Statistic Widgets UI component
The source code for the Dashboard Statistic Widgets UI component can be easily created using Tailwind CSS. The HTML code for the widgets can be created using standard HTML elements, and the styling can be applied using Tailwind CSS classes.
<style>
@import url(https://cdnjs.cloudflare.com/ajax/libs/Chart.js/2.9.3/Chart.min.css);
</style>

<div class="min-w-screen min-h-screen bg-gray-200 flex items-center justify-center px-5 py-5">
    <div class="w-full max-w-3xl">
        <div class="-mx-2 md:flex">
            <div class="w-full md:w-1/3 px-2">
                <div class="rounded-lg shadow-sm mb-4">
                    <div class="rounded-lg bg-white shadow-lg md:shadow-xl relative overflow-hidden">
                        <div class="px-3 pt-8 pb-10 text-center relative z-10">
                            <h4 class="text-sm uppercase text-gray-500 leading-tight">Users</h4>
                            <h3 class="text-3xl text-gray-700 font-semibold leading-tight my-3">3,682</h3>
                            <p class="text-xs text-green-500 leading-tight">▲ 57.1%</p>
                        </div>
                        <div class="absolute bottom-0 inset-x-0">
                            <canvas id="chart1" height="70"></canvas>
                        </div>
                    </div>
                </div>
            </div>
            <div class="w-full md:w-1/3 px-2">
                <div class="rounded-lg shadow-sm mb-4">
                    <div class="rounded-lg bg-white shadow-lg md:shadow-xl relative overflow-hidden">
                        <div class="px-3 pt-8 pb-10 text-center relative z-10">
                            <h4 class="text-sm uppercase text-gray-500 leading-tight">Subscribers</h4>
                            <h3 class="text-3xl text-gray-700 font-semibold leading-tight my-3">11,427</h3>
                            <p class="text-xs text-red-500 leading-tight">▼ 42.8%</p>
                        </div>
                        <div class="absolute bottom-0 inset-x-0">
                            <canvas id="chart2" height="70"></canvas>
                        </div>
                    </div>
                </div>
            </div>
            <div class="w-full md:w-1/3 px-2">
                <div class="rounded-lg shadow-sm mb-4">
                    <div class="rounded-lg bg-white shadow-lg md:shadow-xl relative overflow-hidden">
                        <div class="px-3 pt-8 pb-10 text-center relative z-10">
                            <h4 class="text-sm uppercase text-gray-500 leading-tight">Comments</h4>
                            <h3 class="text-3xl text-gray-700 font-semibold leading-tight my-3">8,028</h3>
                            <p class="text-xs text-green-500 leading-tight">▲ 8.2%</p>
                        </div>
                        <div class="absolute bottom-0 inset-x-0">
                            <canvas id="chart3" height="70"></canvas>
                        </div>
                    </div>
                </div>
            </div>
        </div>
    </div>
</div>

<script src="https://cdnjs.cloudflare.com/ajax/libs/Chart.js/2.9.3/Chart.min.js"></script>
<script>
const chartOptions = {
    maintainAspectRatio: false,
    legend: {
        display: false,
    },
    tooltips: {
        enabled: false,
    },
    elements: {
        point: {
            radius: 0
        },
    },
    scales: {
        xAxes: [{
            gridLines: false,
            scaleLabel: false,
            ticks: {
                display: false
            }
        }],
        yAxes: [{
            gridLines: false,
            scaleLabel: false,
            ticks: {
                display: false,
                suggestedMin: 0,
                suggestedMax: 10
            }
        }]
    }
};
//
var ctx = document.getElementById('chart1').getContext('2d');
var chart = new Chart(ctx, {
    type: "line",
    data: {
        labels: [1, 2, 1, 3, 5, 4, 7],
        datasets: [
            {
                backgroundColor: "rgba(101, 116, 205, 0.1)",
                borderColor: "rgba(101, 116, 205, 0.8)",
                borderWidth: 2,
                data: [1, 2, 1, 3, 5, 4, 7],
            },
        ],
    },
    options: chartOptions
});
//
var ctx = document.getElementById('chart2').getContext('2d');
var chart = new Chart(ctx, {
    type: "line",
    data: {
        labels: [2, 3, 2, 9, 7, 7, 4],
        datasets: [
            {
                backgroundColor: "rgba(246, 109, 155, 0.1)",
                borderColor: "rgba(246, 109, 155, 0.8)",
                borderWidth: 2,
                data: [2, 3, 2, 9, 7, 7, 4],
            },
        ],
    },
    options: chartOptions
});
//
var ctx = document.getElementById('chart3').getContext('2d');
var chart = new Chart(ctx, {
    type: "line",
    data: {
        labels: [2, 5, 1, 3, 2, 6, 7],
        datasets: [
            {
                backgroundColor: "rgba(246, 153, 63, 0.1)",
                borderColor: "rgba(246, 153, 63, 0.8)",
                borderWidth: 2,
                data: [2, 5, 1, 3, 2, 6, 7],
            },
        ],
    },
    options: chartOptions
});
</script>

<!-- BUY ME A BEER AND HELP SUPPORT OPEN-SOURCE RESOURCES -->
<div class="flex items-end justify-end fixed bottom-0 right-0 mb-4 mr-4 z-10">
    <div>
        <a title="Buy me a beer" href="https://www.buymeacoffee.com/scottwindon" target="_blank" class="block w-16 h-16 rounded-full transition-all shadow hover:shadow-lg transform hover:scale-110 hover:rotate-12">
            <img class="object-cover object-center w-full h-full rounded-full" src="https://i.pinimg.com/originals/60/fd/e8/60fde811b6be57094e0abc69d9c2622a.jpg"/>
        </a>
    </div>
</div>
How to create a Dashboard Statistic Widgets with Tailwind CSS?
Creating a Dashboard Statistic Widgets UI component with Tailwind CSS is easy and straightforward. Here are the steps:
- Create a new HTML file and add the necessary HTML elements for the widgets.
- Add Tailwind CSS to the HTML file by including the CDN link or by installing it using npm.
- Apply the necessary Tailwind CSS classes to the HTML elements to style the widgets.
- Customize the widgets by changing the data and styles as required.
- Test the Dashboard Statistic Widgets UI component in different screen sizes to ensure that it is responsive.
Conclusion
Creating a Dashboard Statistic Widgets UI component with Tailwind CSS is an effective way to provide users with a quick overview of important data. Tailwind CSS provides a set of pre-defined classes that can be used to style the widgets, saving developers a lot of time and effort. With Tailwind CSS, developers can easily create responsive designs for different screen sizes.