- Published on
Here Are 6 Ways To Build A Dashboard Statistics Cards With Tailwind CSS
- What is Tailwind CSS?
- The description of Dashboard statistics cards UI component
- Why use Tailwind CSS to create a Dashboard statistics cards UI component?
- The preview of Dashboard statistics cards UI component
- The source code of Dashboard statistics cards UI component
- How to create a Dashboard statistics cards with Tailwind CSS?
- Step 1: Set up the HTML structure
- Step 2: Add content to the cards
- Step 3: Customize the design
- Conclusion
As a FrontEnd technology blogger, it's important to stay up-to-date with the latest tools and techniques. One such tool that has gained popularity in recent years is Tailwind CSS. Tailwind CSS is a utility-first CSS framework that helps you quickly build custom designs. In this article, we'll explore how to use Tailwind CSS to create a Dashboard statistics cards UI component.
What is Tailwind CSS?
Tailwind CSS is a utility-first CSS framework that provides a set of pre-defined CSS classes that you can use to style your HTML elements. Unlike other CSS frameworks, Tailwind CSS doesn't have pre-built components, but instead, it provides you with a set of low-level utility classes that you can use to build your own custom designs.
The description of Dashboard statistics cards UI component
A Dashboard statistics cards UI component is a set of cards that display important statistics or metrics in a dashboard. These cards are usually displayed in a grid layout and can be used to provide an overview of the most important information at a glance.
Why use Tailwind CSS to create a Dashboard statistics cards UI component?
Tailwind CSS provides a set of utility classes that make it easy to create custom designs. With Tailwind CSS, you don't have to write custom CSS for every design element, but instead, you can use pre-defined classes to style your HTML elements. This saves you time and effort and makes it easy to create responsive designs.
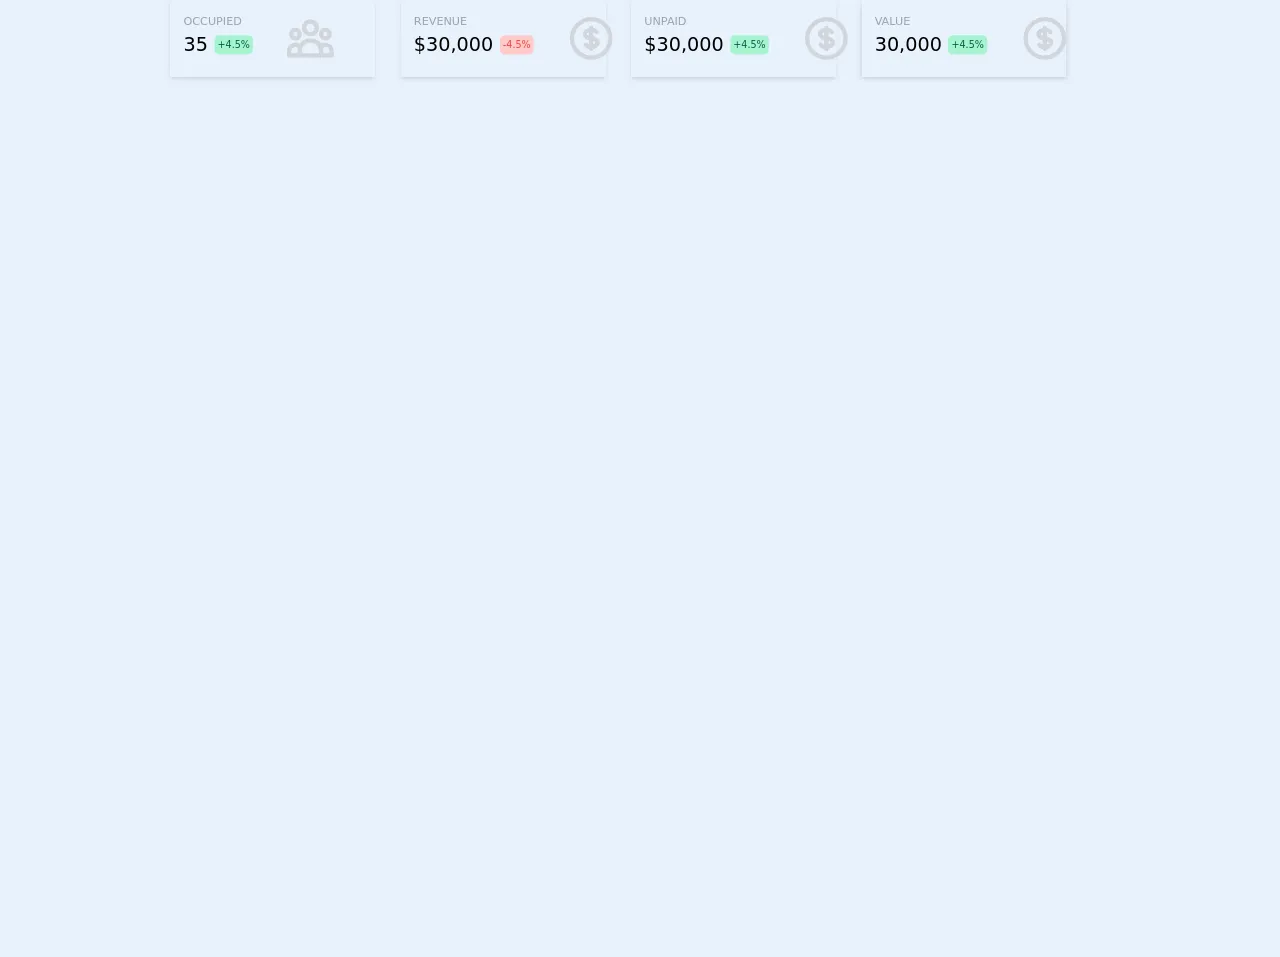
The preview of Dashboard statistics cards UI component
Creating a Dashboard statistics cards UI component with Tailwind CSS is easy. We'll use a grid layout to display the cards, and we'll use Tailwind CSS utility classes to style the cards. Here's a preview of what the Dashboard statistics cards UI component will look like:
Free download of the Dashboard statistics cards's source code
The source code of Dashboard statistics cards UI component
To create the Dashboard statistics cards UI component, we'll use HTML and Tailwind CSS utility classes. Here's the source code:
<div class="flex flex-col md:flex-row justify-center">
        <div class="md:w-11/12">
            <div class="flex md:flex-row space-x-8">
                <div class="shadow-md p-4">
                    <div class="">
                        <div class="flex flex-col">
                            <div class="flex space-x-8 w-56">
                                <div class="">
                                    <div class="uppercase text-sm text-gray-400">
                                        Occupied
                                    </div>
                                <div class="mt-1">
                                        <div class="flex space-x-2 items-center">
                                            <div class="text-2xl">
                                                35
                                            </div>
                                            <div class="text-xs text-green-800 bg-green-200 rounded-md p-1">
                                                +4.5%
                                            </div>
                                        </div>
                                    </div>
                                </div>
                                <div class="">
                                    <svg class="h-16 w-20 text-gray-300" xmlns="http://www.w3.org/2000/svg" fill="none" viewBox="0 0 24 24" stroke="currentColor">
                                        <path stroke-linecap="round" stroke-linejoin="round" stroke-width="2" d="M17 20h5v-2a3 3 0 00-5.356-1.857M17 20H7m10 0v-2c0-.656-.126-1.283-.356-1.857M7 20H2v-2a3 3 0 015.356-1.857M7 20v-2c0-.656.126-1.283.356-1.857m0 0a5.002 5.002 0 019.288 0M15 7a3 3 0 11-6 0 3 3 0 016 0zm6 3a2 2 0 11-4 0 2 2 0 014 0zM7 10a2 2 0 11-4 0 2 2 0 014 0z" />
                                    </svg>
                                </div>
                            </div>
                        </div>
                    </div>
                </div>
                <div class="shadow-md p-4">
                    <div class="">
                        <div class="flex flex-col">
                            <div class="flex space-x-8 w-56">
                                <div class="">
                                    <div class="uppercase text-sm text-gray-400">
                                        Revenue
                                    </div>
                                <div class="mt-1">
                                        <div class="flex space-x-2 items-center">
                                            <div class="text-2xl">
                                                $30,000
                                            </div>
                                            <div class="text-xs text-red-500 bg-red-200 rounded-md p-1">
                                                -4.5%
                                            </div>
                                        </div>
                                    </div>
                                </div>
                                <div class="">
                                    <svg class="h-16 w-20 text-gray-300" xmlns="http://www.w3.org/2000/svg" fill="none" viewBox="0 0 24 24" stroke="currentColor">
                                        <path stroke-linecap="round" stroke-linejoin="round" stroke-width="2" d="M12 8c-1.657 0-3 .895-3 2s1.343 2 3 2 3 .895 3 2-1.343 2-3 2m0-8c1.11 0 2.08.402 2.599 1M12 8V7m0 1v8m0 0v1m0-1c-1.11 0-2.08-.402-2.599-1M21 12a9 9 0 11-18 0 9 9 0 0118 0z" />
                                    </svg>
                                </div>
                            </div>
                        </div>
                    </div>
                </div>
                <div class="shadow-md p-4">
                    <div class="">
                        <div class="flex flex-col">
                            <div class="flex space-x-8 w-56">
                                <div class="">
                                    <div class="uppercase text-sm text-gray-400">
                                        Unpaid
                                    </div>
                                <div class="mt-1">
                                        <div class="flex space-x-2 items-center">
                                            <div class="text-2xl">
                                                $30,000
                                            </div>
                                            <div class="text-xs text-green-800 bg-green-200 rounded-md p-1">
                                                +4.5%
                                            </div>
                                        </div>
                                    </div>
                                </div>
                                <div class="">
                                    <svg class="h-16 w-20 text-gray-300" xmlns="http://www.w3.org/2000/svg" fill="none" viewBox="0 0 24 24" stroke="currentColor">
                                        <path stroke-linecap="round" stroke-linejoin="round" stroke-width="2" d="M12 8c-1.657 0-3 .895-3 2s1.343 2 3 2 3 .895 3 2-1.343 2-3 2m0-8c1.11 0 2.08.402 2.599 1M12 8V7m0 1v8m0 0v1m0-1c-1.11 0-2.08-.402-2.599-1M21 12a9 9 0 11-18 0 9 9 0 0118 0z" />
                                    </svg>
                                </div>
                            </div>
                        </div>
                    </div>
                </div>
                <div class="shadow-md p-4">
                    <div class="">
                        <div class="flex flex-col">
                            <div class="flex space-x-8 w-56">
                                <div class="">
                                    <div class="uppercase text-sm text-gray-400">
                                        Value
                                    </div>
                                <div class="mt-1">
                                        <div class="flex space-x-2 items-center">
                                            <div class="text-2xl">
                                                30,000
                                            </div>
                                            <div class="text-xs text-green-800 bg-green-200 rounded-md p-1">
                                                +4.5%
                                            </div>
                                        </div>
                                    </div>
                                </div>
                                <div class="">
                                    <svg class="h-16 w-20 text-gray-300" xmlns="http://www.w3.org/2000/svg" fill="none" viewBox="0 0 24 24" stroke="currentColor">
                                        <path stroke-linecap="round" stroke-linejoin="round" stroke-width="2" d="M12 8c-1.657 0-3 .895-3 2s1.343 2 3 2 3 .895 3 2-1.343 2-3 2m0-8c1.11 0 2.08.402 2.599 1M12 8V7m0 1v8m0 0v1m0-1c-1.11 0-2.08-.402-2.599-1M21 12a9 9 0 11-18 0 9 9 0 0118 0z" />
                                    </svg>
                                </div>
                            </div>
                        </div>
                    </div>
                </div>
            </div>
        </div>
    </div>
How to create a Dashboard statistics cards with Tailwind CSS?
Now that we've seen a preview of what the Dashboard statistics cards UI component will look like and we've seen the source code, let's dive into how to create the component.
Step 1: Set up the HTML structure
The first step is to set up the HTML structure for the Dashboard statistics cards UI component. We'll use a grid layout to display the cards. Here's the HTML code:
<div class="grid grid-cols-1 sm:grid-cols-2 md:grid-cols-3 lg:grid-cols-4 gap-4">
  <div class="bg-white shadow-md rounded-md p-4">
    <!-- Card content goes here -->
  </div>
  <div class="bg-white shadow-md rounded-md p-4">
    <!-- Card content goes here -->
  </div>
  <div class="bg-white shadow-md rounded-md p-4">
    <!-- Card content goes here -->
  </div>
  <div class="bg-white shadow-md rounded-md p-4">
    <!-- Card content goes here -->
  </div>
</div>
In this code, we've used the grid and grid-cols-* classes to create a grid layout with one column on small screens, two columns on medium screens, three columns on large screens, and four columns on extra-large screens. We've also used the gap-4 class to add a 4-pixel gap between the cards.
Step 2: Add content to the cards
The next step is to add content to the cards. We'll use Tailwind CSS utility classes to style the cards and the content. Here's an example of what a card might look like:
<div class="bg-white shadow-md rounded-md p-4">
  <div class="flex items-center justify-between">
    <div class="text-gray-500 text-sm">Total Sales</div>
    <div class="text-green-500 text-lg font-bold">$10,000</div>
  </div>
  <div class="mt-4">
    <div class="text-gray-500 text-sm">Last 30 days</div>
    <div class="text-gray-800 text-lg font-bold">1,000 sales</div>
  </div>
</div>
In this code, we've used the bg-white, shadow-md, and rounded-md classes to style the card. We've also used the p-4 class to add padding to the card. Inside the card, we've used the flex and items-center classes to horizontally center the content. We've also used the justify-between class to space the content evenly. We've used the text-gray-500, text-sm, text-green-500, text-lg, and font-bold classes to style the text.
Step 3: Customize the design
The final step is to customize the design to fit your needs. You can use Tailwind CSS utility classes to change the colors, fonts, and sizes of the cards and the content. Here are some examples of how you can customize the design:
<div class="bg-blue-500 shadow-md rounded-md p-4">
  <div class="flex items-center justify-between">
    <div class="text-white text-sm">Total Sales</div>
    <div class="text-yellow-500 text-lg font-bold">$10,000</div>
  </div>
  <div class="mt-4">
    <div class="text-white text-sm">Last 30 days</div>
    <div class="text-white text-lg font-bold">1,000 sales</div>
  </div>
</div>
In this code, we've used the bg-blue-500 class to change the background color of the card to blue. We've also used the text-white class to change the text color to white.
Conclusion
In this article, we've explored how to use Tailwind CSS to create a Dashboard statistics cards UI component. We've seen a preview of what the component will look like, we've seen the source code, and we've learned how to create the component step-by-step. With Tailwind CSS, it's easy to create custom designs quickly and efficiently. Give it a try and see how it can improve your workflow!