- Published on
The Ultimate Guide To Help You Make A Dashboard Stats With Tailwind CSS
- What is Tailwind CSS?
- The description of Dashboard stats ui component
- Why use Tailwind CSS to create a Dashboard stats ui component?
- The preview of Dashboard stats ui component
- The source code of Dashboard stats ui component
- How to create a Dashboard stats with Tailwind CSS?
- Conclusion
As a FrontEnd technology blogger, it is important to stay up-to-date with the latest trends and tools in the industry. One such tool that has gained popularity in recent times is Tailwind CSS. In this article, we will explore how to create a Dashboard stats ui component using Tailwind CSS.
What is Tailwind CSS?
Tailwind CSS is a utility-first CSS framework that allows you to quickly build custom designs without writing any CSS. It provides a set of pre-defined classes that can be used to style HTML elements. Tailwind CSS is highly customizable and can be configured to match your specific design needs.
The description of Dashboard stats ui component
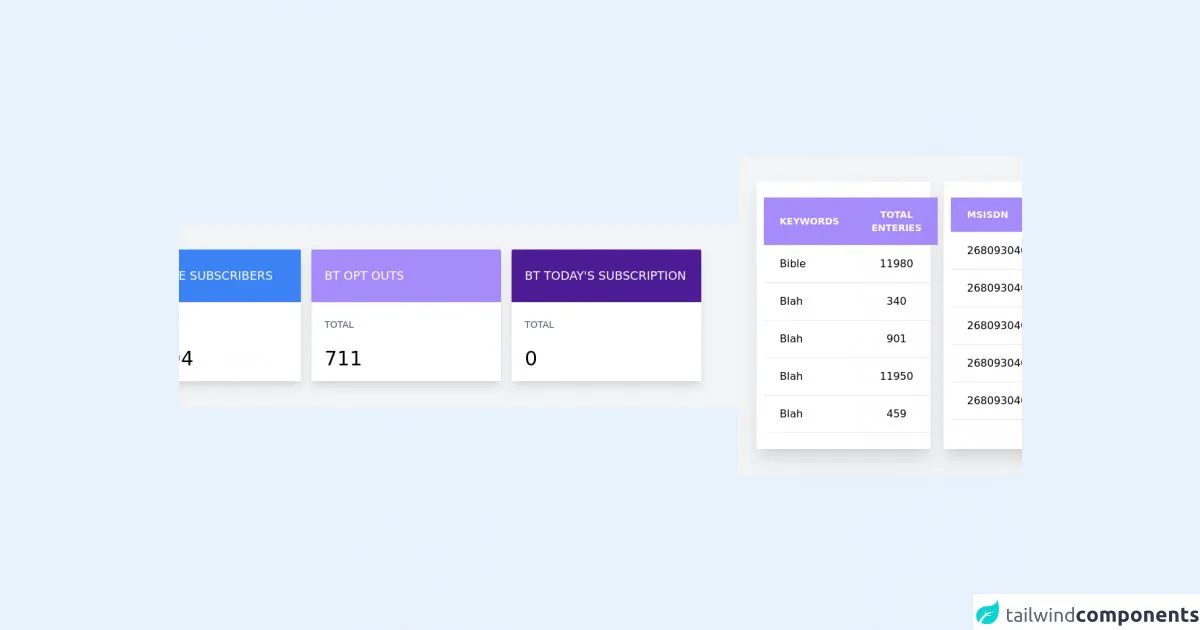
A Dashboard stats ui component is a visual representation of data that provides an overview of key metrics. It is commonly used in business applications to display information such as sales, revenue, and user engagement. A Dashboard stats ui component typically consists of a set of cards that display different metrics.
Why use Tailwind CSS to create a Dashboard stats ui component?
Tailwind CSS provides a set of pre-defined classes that can be used to quickly style HTML elements. This makes it an ideal choice for creating a Dashboard stats ui component. With Tailwind CSS, you can easily customize the look and feel of your Dashboard stats ui component without writing any custom CSS.
The preview of Dashboard stats ui component
Free download of the Dashboard stats's source code
The source code of Dashboard stats ui component
<!doctype html>
<html lang="en">
<head>
    <meta charset="utf-8">
    <meta http-equiv="X-UA-Compatible" content="IE=edge">
    <meta name="viewport" content="width=device-width, initial-scale=1">
    <link href="https://unpkg.com/[email protected]/dist/tailwind.min.css" rel="stylesheet">
    <title>Tailwind stats cards</title>
</head>
<body class="" style="background: #edf2f7;">

<!---===================== FIRST ROW CONTAINING THE  STATS CARD STARTS HERE =============================-->
  <div class="flex justify-center bg-gray-100 py-10 p-14">
    <!---== First Stats Container ====--->
  <div class="container mx-auto pr-4">
    <div class="w-72 bg-white max-w-xs mx-auto rounded-sm overflow-hidden shadow-lg hover:shadow-2xl transition duration-500 transform hover:scale-100 cursor-pointer">
      <div class="h-20 bg-red-400 flex items-center justify-between">
        <p class="mr-0 text-white text-lg pl-5">BT SUBSCRIBERS</p>
      </div>
      <div class="flex justify-between px-5 pt-6 mb-2 text-sm text-gray-600">
        <p>TOTAL</p>
      </div>
      <p class="py-4 text-3xl ml-5">20,456</p>
      <!-- <hr > -->
    </div>
  </div>
      <!---== First Stats Container ====--->

    <!---== Second Stats Container ====--->
  <div class="container mx-auto pr-4">
    <div class="w-72 bg-white max-w-xs mx-auto rounded-sm overflow-hidden shadow-lg hover:shadow-2xl transition duration-500 transform hover:scale-100 cursor-pointer">
      <div class="h-20 bg-blue-500 flex items-center justify-between">
        <p class="mr-0 text-white text-lg pl-5">BT ACTIVE SUBSCRIBERS</p>
      </div>
      <div class="flex justify-between px-5 pt-6 mb-2 text-sm text-gray-600">
        <p>TOTAL</p>
      </div>
      <p class="py-4 text-3xl ml-5">19,694</p>
      <!-- <hr > -->
    </div>
  </div>
    <!---== Second Stats Container ====--->

  <!---== Third Stats Container ====--->
  <div class="container mx-auto pr-4">
    <div class="w-72 bg-white max-w-xs mx-auto rounded-sm overflow-hidden shadow-lg hover:shadow-2xl transition duration-500 transform hover:scale-100 cursor-pointer">
      <div class="h-20 bg-purple-400 flex items-center justify-between">
        <p class="mr-0 text-white text-lg pl-5">BT OPT OUTS</p>
      </div>
      <div class="flex justify-between pt-6 px-5 mb-2 text-sm text-gray-600">
        <p>TOTAL</p>
      </div>
      <p class="py-4 text-3xl ml-5">711</p>
      <!-- <hr > -->
    </div>
  </div>
  <!---== Third Stats Container ====--->

  <!---== Fourth Stats Container ====--->
  <div class="container mx-auto">
    <div class="w-72 bg-white max-w-xs mx-auto rounded-sm overflow-hidden shadow-lg hover:shadow-2xl transition duration-500 transform hover:scale-100 cursor-pointer">
      <div class="h-20 bg-purple-900 flex items-center justify-between">
        <p class="mr-0 text-white text-lg pl-5">BT TODAY'S SUBSCRIPTION</p>
      </div>
      <div class="flex justify-between pt-6 px-5 mb-2 text-sm text-gray-600">
        <p>TOTAL</p>
      </div>
      <p class="py-4 text-3xl ml-5">0</p>
      <!-- <hr > -->
    </div>
  </div>
  <!---== Fourth Stats Container ====--->
</div>
<!---===================== FIRST ROW CONTAINING THE  STATS CARD ENDS HERE =============================-->

<!------===================== SECOND ROW CONTAINING THE TABLE STATS STARTS HERE =============================-->
<div class="flex justify-center bg-gray-100 py-10 p-5">
  <!--==== frist div begins here ====--->
  <div class="container mr-5 ml-2 mx-auto bg-white shadow-xl">
    <div class="w-11/12 mx-auto">
      <div class="bg-white my-6">
        <table class="text-left w-full border-collapse"> <!--Border collapse doesn't work on this site yet but it's available in newer tailwind versions -->
          <thead>
            <tr>
              <th class="py-4 px-6 bg-purple-400 font-bold uppercase text-sm text-white border-b border-grey-light">KEYWORDS</th>
              <th class="py-4 px-6 text-center bg-purple-400 font-bold uppercase text-sm text-white border-b border-grey-light">TOTAL ENTERIES</th>
            </tr>
          </thead>
          <tbody>
            <tr class="hover:bg-grey-lighter">
              <td class="py-4 px-6 border-b border-grey-light">Bible</td>
              <td class="py-4 px-6 text-center border-b border-grey-light">
                11980
              </td>
            </tr>
            <tr class="hover:bg-grey-lighter">
              <td class="py-4 px-6 border-b border-grey-light">Blah</td>
              <td class="py-4 px-6 text-center border-b border-grey-light">
                340
              </td>
            </tr>
            <tr class="hover:bg-grey-lighter">
              <td class="py-4 px-6 border-b border-grey-light">Blah</td>
              <td class="py-4 px-6 text-center border-b border-grey-light">
                901
              </td>
            </tr>
            <tr class="hover:bg-grey-lighter">
              <td class="py-4 px-6 border-b border-grey-light">Blah</td>
              <td class="py-4 px-6 text-center border-b border-grey-light">
                11950
              </td>
            </tr>
            <tr class="hover:bg-grey-lighter">
              <td class="py-4 px-6 border-b border-grey-light">Blah</td>
              <td class="py-4 px-6 text-center border-b border-grey-light">
                459
              </td>
            </tr>
          </tbody>
        </table>
      </div>
      </div>
        </div>
    <!--==== frist div ends here ====--->

    <!--==== Second div begins here ====--->
    <div class="container mr-5 mx-auto bg-white shadow-xl">
      <div class="w-11/12 mx-auto">
        <div class="bg-white my-6">
          <table class="text-left w-full border-collapse"> <!--Border collapse doesn't work on this site yet but it's available in newer tailwind versions -->
            <thead>
              <tr>
                <th class="py-4 px-6 bg-purple-400 font-bold uppercase text-sm text-white border-b border-grey-light">MSISDN</th>
                <th class="py-4 px-6 text-center bg-purple-400 font-bold uppercase text-sm text-white border-b border-grey-light">ENTRIES</th>
              </tr>
            </thead>
            <tbody>
              <tr class="hover:bg-grey-lighter">
                <td class="py-4 px-6 border-b border-grey-light">26809304030</td>
                <td class="py-4 px-6 text-center border-b border-grey-light">
                  495,455
                </td>
              </tr>
              <tr class="hover:bg-grey-lighter">
                <td class="py-4 px-6 border-b border-grey-light">26809304030</td>
                <td class="py-4 px-6 text-center border-b border-grey-light">
                  495,455
                </td>
              </tr>
              <tr class="hover:bg-grey-lighter">
                <td class="py-4 px-6 border-b border-grey-light">26809304030</td>
                <td class="py-4 px-6 text-center border-b border-grey-light">
                  495,455
                </td>
              </tr>
              <tr class="hover:bg-grey-lighter">
                <td class="py-4 px-6 border-b border-grey-light">26809304030</td>
                <td class="py-4 px-6 text-center border-b border-grey-light">
                  32,333
                </td>
              </tr>
              <tr class="hover:bg-grey-lighter">
                <td class="py-4 px-6 border-b border-grey-light">26809304030</td>
                <td class="py-4 px-6 text-center border-b border-grey-light">
                  31,199
                </td>
              </tr>
            </tbody>
          </table>
        </div>
        </div>
          </div>
      <!--==== Second div ends here ====--->

      <!--==== Third div begins here ====--->
      <div class="container mx-auto bg-white shadow-xl">
        <div class="w-11/12 mx-auto">
          <div class="bg-white my-6">
            <table class="text-left w-full border-collapse"> <!--Border collapse doesn't work on this site yet but it's available in newer tailwind versions -->
              <thead>
                <tr>
                  <th class="py-4 px-6 bg-purple-400 font-bold uppercase text-sm text-white border-b border-grey-light">MSISDN</th>
                  <th class="py-4 px-6 text-center bg-purple-400 font-bold uppercase text-sm text-white border-b border-grey-light">POINTS</th>
                </tr>
              </thead>
              <tbody>
                <tr class="hover:bg-grey-lighter">
                  <td class="py-4 px-6 border-b border-grey-light">28679609009</td>
                  <td class="py-4 text-center px-6 border-b border-grey-light">
                    11,290
                  </td>
                </tr>
                <tr class="hover:bg-grey-lighter">
                  <td class="py-4 px-6 border-b border-grey-light">28679609009</td>
                  <td class="py-4 text-center px-6 border-b border-grey-light">
                    9,230
                  </td>
                </tr>
                <tr class="hover:bg-grey-lighter">
                  <td class="py-4 px-6 border-b border-grey-light">28679609009</td>
                  <td class="py-4 px-6 text-center border-b border-grey-light">
                    234
                  </td>
                </tr>
                <tr class="hover:bg-grey-lighter">
                  <td class="py-4 px-6 border-b border-grey-light">28679609009</td>
                  <td class="py-4 px-6 text-center border-b border-grey-light">
                    56,230
                  </td>
                </tr>
                <tr class="hover:bg-grey-lighter">
                  <td class="py-4 px-6 border-b border-grey-light">28679609009</td>
                  <td class="py-4 px-6 text-center border-b border-grey-light">
                    323
                  </td>
                </tr>
              </tbody>
            </table>
          </div>
          </div>
            </div>
        <!--==== Third div ends here ====--->
    </div>
<!---------===================== SECOND ROW CONTAINING THE TABLE STATS ENDS HERE =============================-->

</body>
</html>
How to create a Dashboard stats with Tailwind CSS?
To create a Dashboard stats ui component with Tailwind CSS, follow these steps:
Create a new HTML file and add the necessary HTML markup for the Dashboard stats ui component. This typically includes a set of cards that display different metrics.
Add the necessary Tailwind CSS classes to style the HTML elements. You can use the pre-defined classes provided by Tailwind CSS or create your own custom classes.
Customize the look and feel of your Dashboard stats ui component by modifying the Tailwind CSS configuration file. This allows you to change the colors, fonts, and other design elements to match your specific needs.
Test your Dashboard stats ui component in different browsers and devices to ensure that it displays correctly.
Conclusion
Creating a Dashboard stats ui component with Tailwind CSS is a great way to quickly build custom designs without writing any custom CSS. With its pre-defined classes and highly customizable configuration options, Tailwind CSS is an ideal choice for creating Dashboard stats ui components. By following the steps outlined in this article, you can easily create a Dashboard stats ui component that meets your specific design needs.