- Published on
How To Build A Statistics With Tailwind CSS In 5 Easy Steps
- What is Tailwind CSS?
- The description of Statistics ui component
- Why use Tailwind CSS to create a Statistics ui component?
- The preview of Statistics ui component
- The source code of Statistics ui component
- How to create a Statistics with Tailwind CSS?
- Conclusion
What is Tailwind CSS?
Tailwind CSS is a utility-first CSS framework that provides pre-defined classes to style HTML elements. It allows developers to quickly and easily create custom designs without having to write CSS from scratch. Tailwind CSS is gaining popularity among developers due to its flexibility and ease of use.
The description of Statistics ui component
A Statistics UI component is a visual representation of data that displays information in a graphical format. It can be used to show data such as sales figures, website traffic, or social media engagement. The Statistics UI component typically consists of a set of numbers or percentages displayed in a visually appealing way.
Why use Tailwind CSS to create a Statistics ui component?
Tailwind CSS makes it easy to create a Statistics UI component quickly and efficiently. With pre-defined classes for typography, colors, and spacing, developers can easily customize the component to match their design needs. Additionally, Tailwind CSS is mobile-responsive, which means the Statistics UI component will look great on any device.
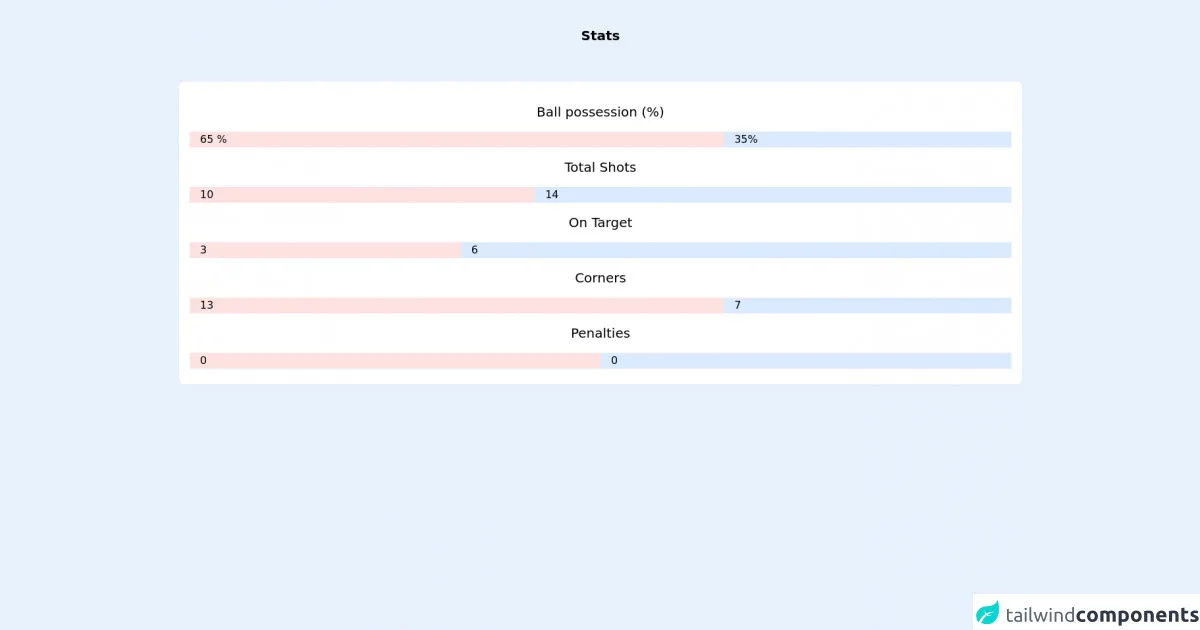
The preview of Statistics ui component
To create a Statistics UI component with Tailwind CSS, we will use a simple design with three numbers and their corresponding labels. The component will be displayed in a row with equal spacing between each element.
Free download of the Statistics's source code
The source code of Statistics ui component
To create the Statistics UI component, we will use HTML and Tailwind CSS classes. The HTML structure will consist of a parent div with three child divs, each containing a number and label. We will use Tailwind CSS classes to style the component and add spacing between each element.
<div class="container mx-auto">
        <h2 class="p-2 sm:p-10 text-xl font-bold text-center">Stats</h2>
        <div class="mt-4 mb-12 px-4 pt-4 pb-12 justify-between bg-white dark:bg-gray-600 shadow-sm rounded-lg">
            <div class="justify-center">
                <div class="text-base text-xl text-center py-4 clear-both">Ball possession (%)</div>
                <div>
                <div class="float-left bg-red-100 pl-4" style="width: 65%;">
                    65 %
                </div>
                <div class="float-left w-1/5 bg-blue-100 pl-4" style="width: 35%;">
                    35%
                </div>
                </div>
                <div class="text-base text-xl text-center py-4 clear-both">Total Shots</div>
                <div>
                <div class="float-left bg-red-100 pl-4" style="width: 42%;">
                    10
                </div>
                <div class="float-left w-1/5 bg-blue-100 pl-4" style="width: 58%;">
                    14
                </div>
                </div>
                <div class="text-base text-xl text-center py-4 clear-both">On Target</div>
                <div>
                <div class="float-left bg-red-100 pl-4" style="width: 33%;">
                    3
                </div>
                <div class="float-left w-1/5 bg-blue-100 pl-4" style="width: 67%;">
                    6
                </div>
                </div>
                <div class="text-base text-xl text-center py-4 clear-both">Corners</div>
                <div>
                <div class="float-left bg-red-100 pl-4" style="width: 65%;">
                    13
                </div>
                <div class="float-left w-1/5 bg-blue-100 pl-4" style="width: 35%;">
                    7
                </div>
                </div>
                <div class="text-base text-xl text-center py-4 clear-both">Penalties</div>
                <div>
                <div class="float-left bg-red-100 pl-4" style="width: 50%;">
                    0
                </div>
                <div class="float-left w-1/5 bg-blue-100 pl-4" style="width: 50%;">
                    0
                </div>
                </div>
        </div>
    </div>
</div>
How to create a Statistics with Tailwind CSS?
Step 1: Set up the HTML structure
To create the Statistics UI component, we will first set up the HTML structure. We will create a parent div with three child divs, each containing a number and label.
<div class="flex justify-center">
  <div class="text-center">
    <h2 class="text-4xl font-bold">10K</h2>
    <p class="text-gray-500">Visitors</p>
  </div>
  <div class="text-center">
    <h2 class="text-4xl font-bold">25K</h2>
    <p class="text-gray-500">Pageviews</p>
  </div>
  <div class="text-center">
    <h2 class="text-4xl font-bold">5K</h2>
    <p class="text-gray-500">Downloads</p>
  </div>
</div>
Step 2: Add Tailwind CSS classes
Next, we will add Tailwind CSS classes to style the component. We will use classes such as flex, justify-center, text-center, text-4xl, font-bold, and text-gray-500 to achieve the desired design.
<div class="flex justify-center">
  <div class="text-center bg-white rounded-lg shadow-lg p-8 m-4">
    <h2 class="text-4xl font-bold">10K</h2>
    <p class="text-gray-500">Visitors</p>
  </div>
  <div class="text-center bg-white rounded-lg shadow-lg p-8 m-4">
    <h2 class="text-4xl font-bold">25K</h2>
    <p class="text-gray-500">Pageviews</p>
  </div>
  <div class="text-center bg-white rounded-lg shadow-lg p-8 m-4">
    <h2 class="text-4xl font-bold">5K</h2>
    <p class="text-gray-500">Downloads</p>
  </div>
</div>
Step 3: Customize the design
We can further customize the design by adding our own colors and adjusting the spacing between each element. For example, we can add a custom color by using the bg-indigo-500 class and adjust the spacing by using the mx-4 class.
<div class="flex justify-center">
  <div class="text-center bg-white rounded-lg shadow-lg p-8 m-4">
    <h2 class="text-4xl font-bold">10K</h2>
    <p class="text-gray-500">Visitors</p>
  </div>
  <div class="text-center bg-white rounded-lg shadow-lg p-8 m-4">
    <h2 class="text-4xl font-bold">25K</h2>
    <p class="text-gray-500">Pageviews</p>
  </div>
  <div class="text-center bg-indigo-500 text-white rounded-lg shadow-lg p-8 m-4">
    <h2 class="text-4xl font-bold">5K</h2>
    <p class="text-gray-500">Downloads</p>
  </div>
</div>
Step 4: Add responsiveness
Finally, we can add responsiveness to the component by using Tailwind CSS classes such as sm:text-2xl and md:text-3xl. These classes will adjust the font size based on the screen size.
<div class="flex flex-wrap justify-center">
  <div class="text-center bg-white rounded-lg shadow-lg p-8 m-4 sm:w-1/2 md:w-auto">
    <h2 class="text-4xl sm:text-2xl md:text-3xl font-bold">10K</h2>
    <p class="text-gray-500">Visitors</p>
  </div>
  <div class="text-center bg-white rounded-lg shadow-lg p-8 m-4 sm:w-1/2 md:w-auto">
    <h2 class="text-4xl sm:text-2xl md:text-3xl font-bold">25K</h2>
    <p class="text-gray-500">Pageviews</p>
  </div>
  <div class="text-center bg-indigo-500 text-white rounded-lg shadow-lg p-8 m-4 sm:w-1/2 md:w-auto">
    <h2 class="text-4xl sm:text-2xl md:text-3xl font-bold">5K</h2>
    <p class="text-gray-500">Downloads</p>
  </div>
</div>
Step 5: Use the Statistics UI component
Once we have created the Statistics UI component, we can easily use it in our projects by copying and pasting the HTML and CSS code.
Conclusion
In this article, we learned how to create a Statistics UI component with Tailwind CSS in 5 easy steps. By using pre-defined classes and customizing the design, we were able to create a visually appealing component that is mobile-responsive and easy to use. Tailwind CSS is a powerful tool for developers who want to create custom designs quickly and efficiently.