- Published on
A Complete Guide To Make A Data Display - Stats With Tailwind CSS
- What is Tailwind CSS?
- The description of Data Display - Stats ui component
- Why use Tailwind CSS to create a Data Display - Stats ui component?
- The preview of Data Display - Stats ui component
- The source code of Data Display - Stats ui component
- How to create a Data Display - Stats with Tailwind CSS?
- Step 1: Set up your project
- Step 2: Create the HTML structure
- Step 3: Style the HTML with Tailwind CSS
- Step 4: Customize the component
- Conclusion
What is Tailwind CSS?
Tailwind CSS is a utility-first CSS framework that allows you to rapidly build custom user interfaces. It provides a set of pre-defined CSS classes that you can use to style your HTML elements. With Tailwind CSS, you can create complex designs without having to write any custom CSS.
The description of Data Display - Stats ui component
Data Display - Stats is a UI component that displays statistical data in a visually appealing way. It is commonly used in dashboards, analytics tools, and other data-driven applications. The component typically includes a title, a set of data points, and a chart or graph that visualizes the data.
Why use Tailwind CSS to create a Data Display - Stats ui component?
Tailwind CSS is an ideal choice for creating a Data Display - Stats UI component. It provides a comprehensive set of utility classes that allow you to quickly and easily style your component. With Tailwind CSS, you can easily create a responsive and visually appealing Data Display - Stats component that looks great on any device.
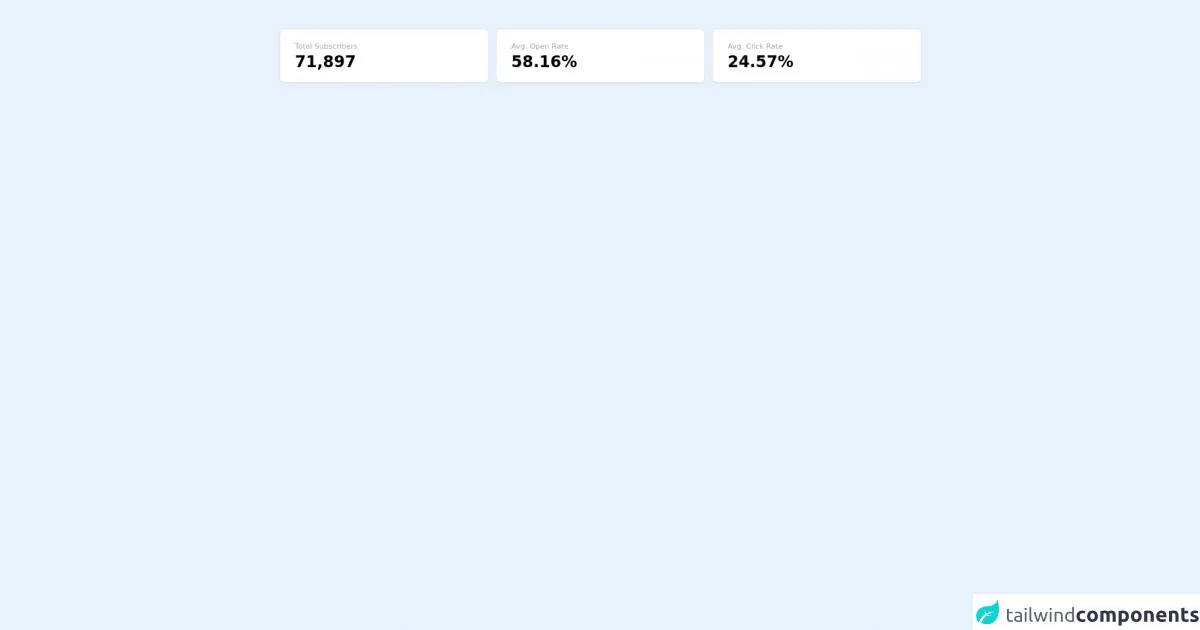
The preview of Data Display - Stats ui component
To create a Data Display - Stats UI component with Tailwind CSS, we will use a combination of HTML and CSS. Here's a preview of what the component will look like:
Free download of the Data Display - Stats's source code
The source code of Data Display - Stats ui component
Here's the HTML and CSS code that we'll use to create the Data Display - Stats UI component:
<div class="max-w-full mx-4 py-6 sm:mx-auto sm:px-6 lg:px-8">
    <div class="sm:flex sm:space-x-4">
        <div class="inline-block align-bottom bg-white rounded-lg text-left overflow-hidden shadow transform transition-all mb-4 w-full sm:w-1/3 sm:my-8">
            <div class="bg-white p-5">
                <div class="sm:flex sm:items-start">
                    <div class="text-center sm:mt-0 sm:ml-2 sm:text-left">
                        <h3 class="text-sm leading-6 font-medium text-gray-400">Total Subscribers</h3>
                        <p class="text-3xl font-bold text-black">71,897</p>
                    </div>
                </div>
            </div>
        </div>
        <div class="inline-block align-bottom bg-white rounded-lg text-left overflow-hidden shadow transform transition-all mb-4 w-full sm:w-1/3 sm:my-8">
            <div class="bg-white p-5">
                <div class="sm:flex sm:items-start">
                    <div class="text-center sm:mt-0 sm:ml-2 sm:text-left">
                        <h3 class="text-sm leading-6 font-medium text-gray-400">Avg. Open Rate</h3>
                        <p class="text-3xl font-bold text-black">58.16%</p>
                    </div>
                </div>
            </div>
        </div>
        <div class="inline-block align-bottom bg-white rounded-lg text-left overflow-hidden shadow transform transition-all mb-4 w-full sm:w-1/3 sm:my-8">
            <div class="bg-white p-5">
                <div class="sm:flex sm:items-start">
                    <div class="text-center sm:mt-0 sm:ml-2 sm:text-left">
                        <h3 class="text-sm leading-6 font-medium text-gray-400">Avg. Click Rate</h3>
                        <p class="text-3xl font-bold text-black">24.57%</p>
                    </div>
                </div>
            </div>
        </div>
    </div>
</div>
How to create a Data Display - Stats with Tailwind CSS?
Now that we have a preview of what the component will look like and the source code we'll use to create it, let's dive into the steps to create a Data Display - Stats UI component with Tailwind CSS.
Step 1: Set up your project
The first step is to set up your project. You can either use a code editor like VS Code or an online editor like CodePen. Once you have your project set up, you'll need to include the Tailwind CSS stylesheet in your HTML file.
<link href="https://cdn.jsdelivr.net/npm/tailwindcss@latest/dist/tailwind.min.css" rel="stylesheet">
Step 2: Create the HTML structure
Next, we'll create the HTML structure for our Data Display - Stats UI component. We'll use a combination of HTML tags and Tailwind CSS classes to create the structure.
<div class="bg-white rounded-lg shadow-lg p-6">
  <h2 class="text-xl font-bold mb-4">Sales Statistics</h2>
  <div class="flex items-center justify-between mb-4">
    <div class="w-1/2">
      <p class="text-gray-600">Total Sales</p>
      <p class="text-3xl font-bold">$50,000</p>
    </div>
    <div class="w-1/2">
      <p class="text-gray-600">Total Customers</p>
      <p class="text-3xl font-bold">100</p>
    </div>
  </div>
  <div class="bg-gray-200 h-2 rounded-full">
    <div class="bg-blue-500 h-2 rounded-full w-3/4"></div>
  </div>
</div>
Step 3: Style the HTML with Tailwind CSS
Now that we have the HTML structure in place, we can start styling it with Tailwind CSS. We'll use a combination of utility classes to style the various elements of the component.
<div class="bg-white rounded-lg shadow-lg p-6">
  <h2 class="text-xl font-bold mb-4">Sales Statistics</h2>
  <div class="flex items-center justify-between mb-4">
    <div class="w-1/2">
      <p class="text-gray-600">Total Sales</p>
      <p class="text-3xl font-bold">$50,000</p>
    </div>
    <div class="w-1/2">
      <p class="text-gray-600">Total Customers</p>
      <p class="text-3xl font-bold">100</p>
    </div>
  </div>
  <div class="bg-gray-200 h-2 rounded-full">
    <div class="bg-blue-500 h-2 rounded-full w-3/4"></div>
  </div>
</div>
Step 4: Customize the component
Finally, we can customize the Data Display - Stats UI component to match our design requirements. We can change the colors, font sizes, and other properties using Tailwind CSS classes.
<div class="bg-white rounded-lg shadow-lg p-6">
  <h2 class="text-xl font-bold mb-4 text-gray-800">Sales Statistics</h2>
  <div class="flex items-center justify-between mb-4">
    <div class="w-1/2">
      <p class="text-gray-600">Total Sales</p>
      <p class="text-3xl font-bold text-gray-800">$50,000</p>
    </div>
    <div class="w-1/2">
      <p class="text-gray-600">Total Customers</p>
      <p class="text-3xl font-bold text-gray-800">100</p>
    </div>
  </div>
  <div class="bg-gray-200 h-2 rounded-full">
    <div class="bg-blue-500 h-2 rounded-full w-3/4"></div>
  </div>
</div>
Conclusion
Tailwind CSS is a powerful utility-first CSS framework that allows you to rapidly build custom user interfaces. With its comprehensive set of utility classes, you can easily create a responsive and visually appealing Data Display - Stats UI component that looks great on any device. By following the steps outlined in this guide, you can create your own Data Display - Stats UI component with Tailwind CSS.