- Published on
The Ultimate Guide To Help You Build A Chart Widget With Tailwind CSS
- What is Tailwind CSS?
- The description of Chart Widget ui component
- Why use Tailwind CSS to create a Chart Widget ui component?
- The preview of Chart Widget ui component
- The source code of Chart Widget ui component
- How to create a Chart Widget with Tailwind CSS?
- Conclusion
As a FrontEnd technology blogger, you might have heard about Tailwind CSS. If not, then you are in the right place. In this article, we will discuss how to build a Chart Widget with Tailwind CSS. We will start with an introduction to Tailwind CSS, then move on to the description of Chart Widget ui component, why to use Tailwind CSS to create a Chart Widget ui component, the preview of Chart Widget ui component, the source code of Chart Widget ui component, and finally, how to create a Chart Widget with Tailwind CSS.
What is Tailwind CSS?
Tailwind CSS is a utility-first CSS framework that helps you to create custom designs without writing any CSS code. It provides you with a set of pre-defined classes that you can use to style your HTML elements. Tailwind CSS is easy to use, and it saves a lot of time.
The description of Chart Widget ui component
A Chart Widget is a graphical representation of data that helps the user to understand the data more easily. It is a popular ui component that is used in many web applications. A Chart Widget can be created using various libraries and frameworks, but in this article, we will use Tailwind CSS to create a Chart Widget.
Why use Tailwind CSS to create a Chart Widget ui component?
Tailwind CSS provides you with a set of pre-defined classes that you can use to create a Chart Widget. It saves a lot of time and effort, and you can create a Chart Widget in a few minutes. Tailwind CSS is also easy to learn, and you don't need to have any prior knowledge of CSS to use it.
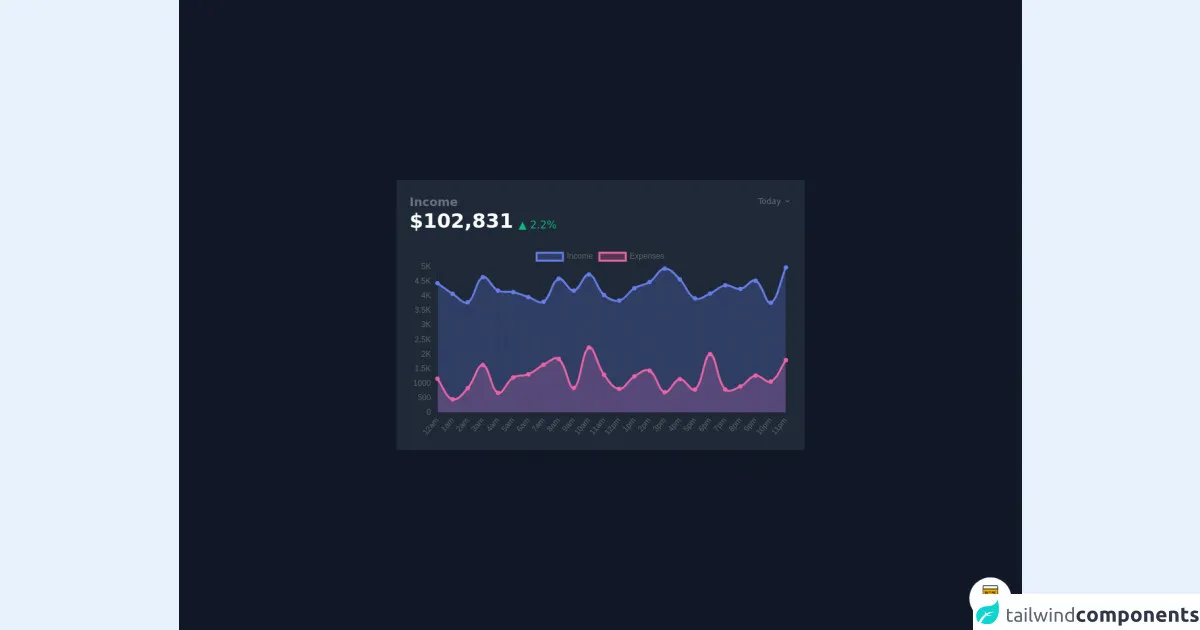
The preview of Chart Widget ui component
To create a Chart Widget with Tailwind CSS, we will use the following classes:
bg-white: Sets the background color of the Chart Widget to white.shadow-md: Adds a shadow effect to the Chart Widget.rounded-lg: Rounds the corners of the Chart Widget.p-6: Adds padding to the Chart Widget.text-gray-700: Sets the text color of the Chart Widget to gray.
Free download of the Chart Widget's source code
The source code of Chart Widget ui component
To create a Chart Widget with Tailwind CSS, you can use the following HTML code:
<div class="bg-white shadow-md rounded-lg p-6">
  <h2 class="text-gray-700 text-lg font-medium">Chart Widget</h2>
  <p class="text-gray-700 mt-4">This is a Chart Widget.</p>
</div>
<script src="https://cdn.jsdelivr.net/gh/alpinejs/[email protected]/dist/alpine.js" defer></script>
<script src="https://cdnjs.cloudflare.com/ajax/libs/Chart.js/2.9.3/Chart.min.js" defer></script>

<style>
@import url(https://cdnjs.cloudflare.com/ajax/libs/MaterialDesign-Webfont/5.3.45/css/materialdesignicons.min.css);
@import url(https://cdnjs.cloudflare.com/ajax/libs/Chart.js/2.9.3/Chart.min.css);
</style>

<div class="min-w-screen min-h-screen bg-gray-900 flex items-center justify-center px-5 py-5">
    <div class="bg-gray-800 text-gray-500 rounded shadow-xl py-5 px-5 w-full lg:w-1/2" x-data="{chartData:chartData()}" x-init="chartData.fetch()">
        <div class="flex flex-wrap items-end">
            <div class="flex-1">
                <h3 class="text-lg font-semibold leading-tight">Income</h3>
            </div>
            <div class="relative" @click.away="chartData.showDropdown=false">
                <button class="text-xs hover:text-gray-300 h-6 focus:outline-none" @click="chartData.showDropdown=!chartData.showDropdown">
                    <span x-text="chartData.options[chartData.selectedOption].label"></span><i class="ml-1 mdi mdi-chevron-down"></i>
                </button>
                <div class="bg-gray-700 shadow-lg rounded text-sm absolute top-auto right-0 min-w-full w-32 z-30 mt-1 -mr-3" x-show="chartData.showDropdown" style="display: none;" x-transition:enter="transition ease duration-300 transform" x-transition:enter-start="opacity-0 translate-y-2" x-transition:enter-end="opacity-100 translate-y-0" x-transition:leave="transition ease duration-300 transform" x-transition:leave-start="opacity-100 translate-y-0" x-transition:leave-end="opacity-0 translate-y-4">
                    <span class="absolute top-0 right-0 w-3 h-3 bg-gray-700 transform rotate-45 -mt-1 mr-3"></span>
                    <div class="bg-gray-700 rounded w-full relative z-10 py-1">
                        <ul class="list-reset text-xs">
                            <template x-for="(item,index) in chartData.options">
                                <li class="px-4 py-2 hover:bg-gray-600 hover:text-white transition-colors duration-100 cursor-pointer" :class="{'text-white':index==chartData.selectedOption}" @click="chartData.selectOption(index);chartData.showDropdown=false">
                                    <span x-text="item.label"></span>
                                </li>
                            </template>
                        </ul>
                    </div>
                </div>
            </div>
        </div>
        <div class="flex flex-wrap items-end mb-5">
            <h4 class="text-2xl lg:text-3xl text-white font-semibold leading-tight inline-block mr-2" x-text="$+(chartData.data?chartData.data[chartData.date].total.comma_formatter():0)">0</h4>
            <span class="inline-block" :class="chartData.data&&chartData.data[chartData.date].upDown<0?'text-red-500':'text-green-500'"><span x-text="chartData.data&&chartData.data[chartData.date].upDown<0?'▼':'▲'">0</span> <span x-text="chartData.data?chartData.data[chartData.date].upDown:0">0</span>%</span>
        </div>
        <div>
            <canvas id="chart" class="w-full"></canvas>
        </div>
    </div>
</div>

<script>
Number.prototype.comma_formatter = function() {
    return this.toString().replace(/\B(?<!\.\d*)(?=(\d{3})+(?!\d))/g, ",");
}

let chartData = function(){
    return {
        date: 'today',
        options: [
            {
                label: 'Today',
                value: 'today',
            },
            {
                label: 'Last 7 Days',
                value: '7days',
            },
            {
                label: 'Last 30 Days',
                value: '30days',
            },
            {
                label: 'Last 6 Months',
                value: '6months',
            },
            {
                label: 'This Year',
                value: 'year',
            },
        ],
        showDropdown: false,
        selectedOption: 0,
        selectOption: function(index){
            this.selectedOption = index;
            this.date = this.options[index].value;
            this.renderChart();
        },
        data: null,
        fetch: function(){
            fetch('https://cdn.jsdelivr.net/gh/swindon/fake-api@master/tailwindAlpineJsChartJsEx1.json')
                .then(res => res.json())
                .then(res => {
                    this.data = res.dates;
                    this.renderChart();
                })
        },
        renderChart: function(){
            let c = false;

            Chart.helpers.each(Chart.instances, function(instance) {
                if (instance.chart.canvas.id == 'chart') {
                    c = instance;
                }
            });

            if(c) {
                c.destroy();
            }

            let ctx = document.getElementById('chart').getContext('2d');

            let chart = new Chart(ctx, {
                type: "line",
                data: {
                    labels: this.data[this.date].data.labels,
                    datasets: [
                        {
                            label: "Income",
                            backgroundColor: "rgba(102, 126, 234, 0.25)",
                            borderColor: "rgba(102, 126, 234, 1)",
                            pointBackgroundColor: "rgba(102, 126, 234, 1)",
                            data: this.data[this.date].data.income,
                        },
                        {
                            label: "Expenses",
                            backgroundColor: "rgba(237, 100, 166, 0.25)",
                            borderColor: "rgba(237, 100, 166, 1)",
                            pointBackgroundColor: "rgba(237, 100, 166, 1)",
                            data: this.data[this.date].data.expenses,
                        },
                    ],
                },
                layout: {
                    padding: {
                        right: 10
                    }
                },
                options: {
                    scales: {
                        yAxes: [{
                            gridLines: {
                                display: false
                            },
                            ticks: {
                                callback: function(value,index,array) {
                                    return value > 1000 ? ((value < 1000000) ? value/1000 + 'K' : value/1000000 + 'M') : value;
                                }
                            }
                        }]
                    }
                }
            });
        }
    }
}
</script>

<!-- BUY ME A BEER AND HELP SUPPORT OPEN-SOURCE RESOURCES -->
<div class="flex items-end justify-end fixed bottom-0 right-0 mb-4 mr-4 z-10">
    <div>
        <a title="Buy me a beer" href="https://www.buymeacoffee.com/scottwindon" target="_blank" class="block w-16 h-16 rounded-full transition-all shadow hover:shadow-lg transform hover:scale-110 hover:rotate-12">
            <img class="object-cover object-center w-full h-full rounded-full" src="https://i.pinimg.com/originals/60/fd/e8/60fde811b6be57094e0abc69d9c2622a.jpg"/>
        </a>
    </div>
</div>
How to create a Chart Widget with Tailwind CSS?
To create a Chart Widget with Tailwind CSS, follow the steps below:
- Create a new HTML file and add the above HTML code to it.
- Add the Tailwind CSS CDN link to the head section of the HTML file.
<head>
  <link href="https://cdn.jsdelivr.net/npm/tailwindcss@latest/dist/tailwind.min.css" rel="stylesheet">
</head>
- Save the HTML file and open it in a web browser.
Conclusion
In this article, we have discussed how to build a Chart Widget with Tailwind CSS. We started with an introduction to Tailwind CSS, then moved on to the description of Chart Widget ui component, why to use Tailwind CSS to create a Chart Widget ui component, the preview of Chart Widget ui component, the source code of Chart Widget ui component, and finally, how to create a Chart Widget with Tailwind CSS. Tailwind CSS is a powerful CSS framework that can help you to create custom designs without writing any CSS code. It saves a lot of time and effort, and it is easy to learn.