- Published on
How to Create A Chart Filter With Tailwind CSS?
- What is Tailwind CSS?
- The description of Chart Filter UI component
- Why use Tailwind CSS to create a Chart Filter UI component?
- The preview of Chart Filter UI component
- The source code of Chart Filter UI component
- How to create a Chart Filter with Tailwind CSS?
- Conclusion
As a FrontEnd technology blogger, it is important to stay up-to-date with the latest tools and techniques. One tool that has gained popularity in recent years is Tailwind CSS. In this article, we will explore how to create a Chart Filter UI component using Tailwind CSS.
What is Tailwind CSS?
Tailwind CSS is a utility-first CSS framework that allows you to quickly build custom designs without writing any CSS. It provides a set of pre-defined classes that you can use to style your HTML elements. Tailwind CSS is highly customizable, and you can configure it to match your design system.
The description of Chart Filter UI component
A Chart Filter UI component is a user interface element that allows users to filter data displayed on a chart. It typically consists of a set of checkboxes or dropdowns that users can select to filter the data. The Chart Filter UI component is essential for data visualization, as it allows users to focus on specific data points.
Why use Tailwind CSS to create a Chart Filter UI component?
Tailwind CSS is an excellent choice for creating a Chart Filter UI component because it allows you to quickly style your HTML elements without writing any CSS. It provides a set of pre-defined classes that you can use to style your checkboxes, dropdowns, and other UI elements. Additionally, Tailwind CSS is highly customizable, so you can easily match your design system.
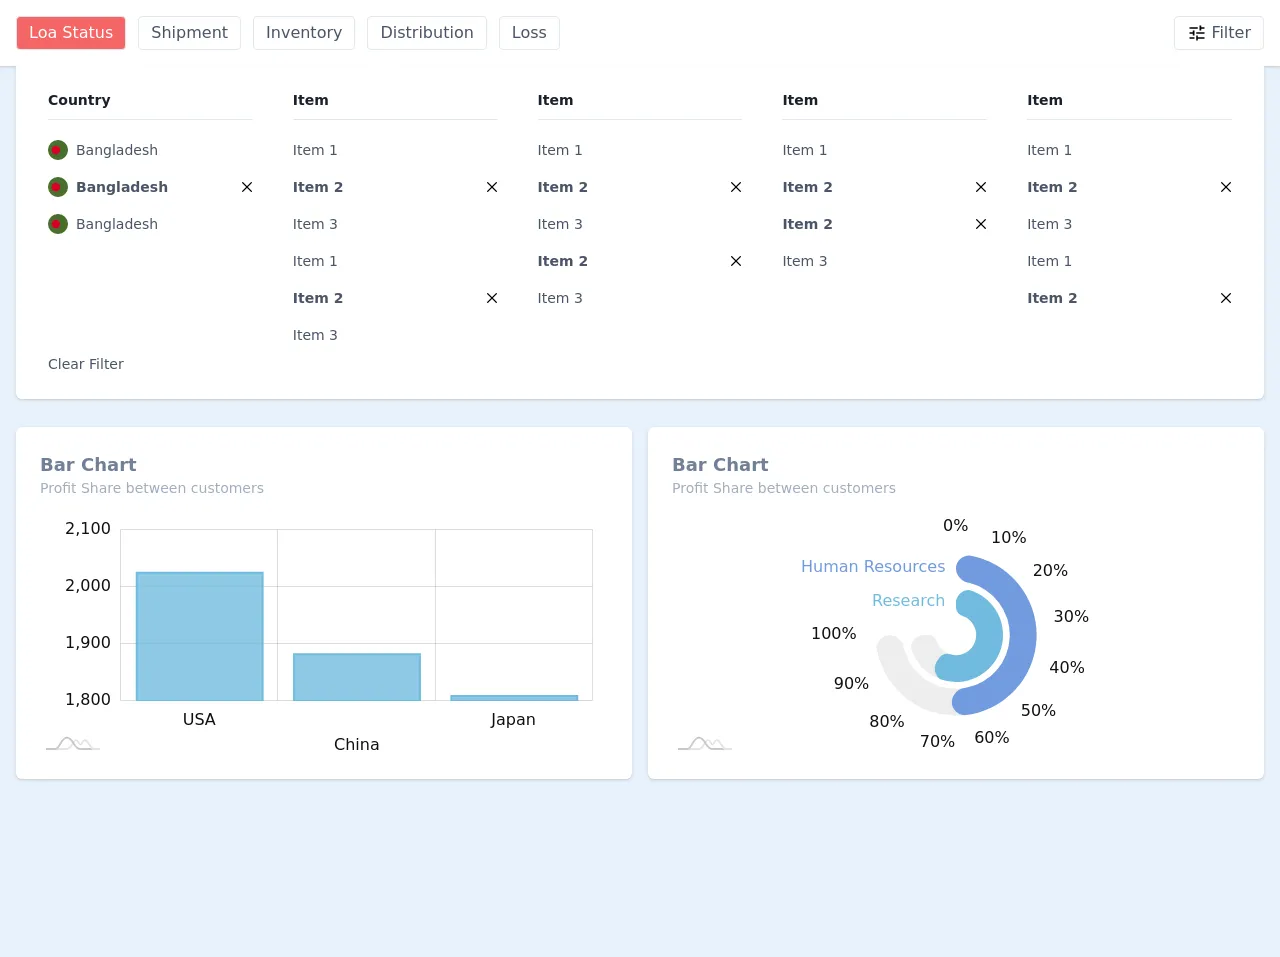
The preview of Chart Filter UI component
To create a Chart Filter UI component with Tailwind CSS, we will use a set of checkboxes to allow users to filter data displayed on a chart. Here is a preview of what the Chart Filter UI component will look like:
Free download of the Chart Filter's source code
The source code of Chart Filter UI component
Here is the source code for the Chart Filter UI component:
<div class="block">

            <div x-data="{ open : false }">
                <div class="bg-white shadow">
                    <div class="container mx-auto px-4 py-4">
						<div class="flex justify-between">
							<div class="flex justify-center">
								<a class="flex items-center px-3 py-1 mr-3 border font-medium rounded  bg-red-500 text-white">Loa Status</a>
								<a class="flex items-center px-3 py-1 mr-3 border font-medium rounded text-gray-700">Shipment</a>
								<a class="flex items-center px-3 py-1 mr-3 border font-medium rounded text-gray-700">Inventory</a>
								<a class="flex items-center px-3 py-1 mr-3 border font-medium rounded text-gray-700">Distribution</a>
								<a class="flex items-center px-3 py-1 mr-3 border font-medium rounded text-gray-700">Loss</a>
							</div>
							<div class="">
								<button type="button" @click="open = !open" class="flex items-center text-gray-700 px-3 py-1 border font-medium rounded">
									<svg viewBox="0 0 24 24" preserveAspectRatio="xMidYMid meet" class="w-5 h-5 mr-1">
										<g class="">
											<path d="M0 0h24v24H0z" fill="none" class=""></path>
											<path d="M3 17v2h6v-2H3zM3 5v2h10V5H3zm10 16v-2h8v-2h-8v-2h-2v6h2zM7 9v2H3v2h4v2h2V9H7zm14 4v-2H11v2h10zm-6-4h2V7h4V5h-4V3h-2v6z" class=""></path>
										</g>
									</svg>
									Filter
								</button>
							</div>
						</div>
                    </div>
                </div>
                <div class="container mx-auto">
                    <div class="flex flex-col mx-4 px-8 py-6 bg-white rounded-b-md shadow"
                        x-show="open"
                        x-transition:enter="transition ease-out origin-top duration-300"
                        x-transition:enter-start="opacity-0 transform scale-90"
                        x-transition:enter-end="opacity-100 transform scale-100"
                        x-transition:leave="transition ease-in origin-top duration-300"
                        x-transition:leave-start="opacity-100 transform scale-100"
                        x-transition:leave-end="opacity-0 transform scale-90"
                        >
						<div class="flex justify-center text-sm text-gray-700">
							<div class="w-1/5 mr-10">
								<h3 class="pb-2 border-b mb-3 text-md text-gray-900 font-semibold">Country</h3>
								<div class="flex flex-col">
									<div class="flex py-2">
										<svg class="h-5 w-5 mr-2" version="1.1" id="Layer_1" xmlns="http://www.w3.org/2000/svg" xmlns:xlink="http://www.w3.org/1999/xlink" x="0px" y="0px"
											viewBox="0 0 512 512" style="enable-background:new 0 0 512 512;" xml:space="preserve">
											<circle style="fill:#496E2D;" cx="256" cy="256" r="256"/>
											<circle style="fill:#D80027;" cx="200.348" cy="256" r="111.304"/>
										</svg>
										<a href="#" class="flex-1">Bangladesh</a>
									</div>
									<div class="flex py-2 font-bold">
										<svg class="h-5 w-5 mr-2" version="1.1" id="Layer_1" xmlns="http://www.w3.org/2000/svg" xmlns:xlink="http://www.w3.org/1999/xlink" x="0px" y="0px"
											viewBox="0 0 512 512" style="enable-background:new 0 0 512 512;" xml:space="preserve">
											<circle style="fill:#496E2D;" cx="256" cy="256" r="256"/>
											<circle style="fill:#D80027;" cx="200.348" cy="256" r="111.304"/>
										</svg>
										<a href="#" class="flex-1">Bangladesh</a>
										<a href="#"><svg class="h-5 py-1" xmlns="http://www.w3.org/2000/svg" viewBox="0 0 20 20"><path d="M10 8.586L2.929 1.515 1.515 2.929 8.586 10l-7.071 7.071 1.414 1.414L10 11.414l7.071 7.071 1.414-1.414L11.414 10l7.071-7.071-1.414-1.414L10 8.586z"/></svg></a>
									</div>
									<div class="flex py-2">
										<svg class="h-5 w-5 mr-2" version="1.1" id="Layer_1" xmlns="http://www.w3.org/2000/svg" xmlns:xlink="http://www.w3.org/1999/xlink" x="0px" y="0px"
											viewBox="0 0 512 512" style="enable-background:new 0 0 512 512;" xml:space="preserve">
											<circle style="fill:#496E2D;" cx="256" cy="256" r="256"/>
											<circle style="fill:#D80027;" cx="200.348" cy="256" r="111.304"/>
										</svg>
										<a href="#" class="flex-1">Bangladesh</a>
									</div>
								</div>
							</div>
							<div class="w-1/5 mr-10">
								<h3 class="pb-2 border-b mb-3 text-md text-gray-900 font-semibold">Item</h3>
								<div class="flex flex-col">
									<div class="flex py-2">
										<a href="#" class="flex-1">Item 1</a>
									</div>
									<div class="flex py-2 font-bold">
										<a href="#" class="flex-1">Item 2</a>
										<a href="#"><svg class="h-5 py-1" xmlns="http://www.w3.org/2000/svg" viewBox="0 0 20 20"><path d="M10 8.586L2.929 1.515 1.515 2.929 8.586 10l-7.071 7.071 1.414 1.414L10 11.414l7.071 7.071 1.414-1.414L11.414 10l7.071-7.071-1.414-1.414L10 8.586z"/></svg></a>
									</div>
									<div class="flex py-2">
										<a href="#" class="flex-1">Item 3</a>
									</div>
									<div class="flex py-2">
										<a href="#" class="flex-1">Item 1</a>
									</div>
									<div class="flex py-2 font-bold">
										<a href="#" class="flex-1">Item 2</a>
										<a href="#"><svg class="h-5 py-1" xmlns="http://www.w3.org/2000/svg" viewBox="0 0 20 20"><path d="M10 8.586L2.929 1.515 1.515 2.929 8.586 10l-7.071 7.071 1.414 1.414L10 11.414l7.071 7.071 1.414-1.414L11.414 10l7.071-7.071-1.414-1.414L10 8.586z"/></svg></a>
									</div>
									<div class="flex py-2">
										<a href="#" class="flex-1">Item 3</a>
									</div>
								</div>
							</div>
							<div class="w-1/5 mr-10">
								<h3 class="pb-2 border-b mb-3 text-md text-gray-900 font-semibold">Item</h3>
								<div class="flex flex-col">
									<div class="flex py-2">
										<a href="#" class="flex-1">Item 1</a>
									</div>
									<div class="flex py-2 font-bold">
										<a href="#" class="flex-1">Item 2</a>
										<a href="#"><svg class="h-5 py-1" xmlns="http://www.w3.org/2000/svg" viewBox="0 0 20 20"><path d="M10 8.586L2.929 1.515 1.515 2.929 8.586 10l-7.071 7.071 1.414 1.414L10 11.414l7.071 7.071 1.414-1.414L11.414 10l7.071-7.071-1.414-1.414L10 8.586z"/></svg></a>
									</div>
									<div class="flex py-2">
										<a href="#" class="flex-1">Item 3</a>
									</div>
								</div>
							</div>
							<div class="w-1/5 mr-10">
								<h3 class="pb-2 border-b mb-3 text-md text-gray-900 font-semibold">Item</h3>
								<div class="flex flex-col">
									<div class="flex py-2">
										<a href="#" class="flex-1">Item 1</a>
									</div>
									<div class="flex py-2 font-bold">
										<a href="#" class="flex-1">Item 2</a>
										<a href="#"><svg class="h-5 py-1" xmlns="http://www.w3.org/2000/svg" viewBox="0 0 20 20"><path d="M10 8.586L2.929 1.515 1.515 2.929 8.586 10l-7.071 7.071 1.414 1.414L10 11.414l7.071 7.071 1.414-1.414L11.414 10l7.071-7.071-1.414-1.414L10 8.586z"/></svg></a>
									</div>
									<div class="flex py-2">
										<a href="#" class="flex-1">Item 3</a>
									</div>
								</div>
							</div>
							<div class="w-1/5">
								<h3 class="pb-2 border-b mb-3 text-md text-gray-900 font-semibold">Item</h3>
								<div class="flex flex-col">
									<div class="flex py-2">
										<a href="#" class="flex-1">Item 1</a>
									</div>
									<div class="flex py-2 font-bold">
										<a href="#" class="flex-1">Item 2</a>
										<a href="#"><svg class="h-5 py-1" xmlns="http://www.w3.org/2000/svg" viewBox="0 0 20 20"><path d="M10 8.586L2.929 1.515 1.515 2.929 8.586 10l-7.071 7.071 1.414 1.414L10 11.414l7.071 7.071 1.414-1.414L11.414 10l7.071-7.071-1.414-1.414L10 8.586z"/></svg></a>
									</div>
									<div class="flex py-2">
										<a href="#" class="flex-1">Item 3</a>
									</div>
									<div class="flex py-2">
										<a href="#" class="flex-1">Item 1</a>
									</div>
									<div class="flex py-2 font-bold">
										<a href="#" class="flex-1">Item 2</a>
										<a href="#"><svg class="h-5 py-1" xmlns="http://www.w3.org/2000/svg" viewBox="0 0 20 20"><path d="M10 8.586L2.929 1.515 1.515 2.929 8.586 10l-7.071 7.071 1.414 1.414L10 11.414l7.071 7.071 1.414-1.414L11.414 10l7.071-7.071-1.414-1.414L10 8.586z"/></svg></a>
									</div>
								</div>
							</div>
						</div>
						<div class="flex">
							<a class="text-gray-700 font-normal text-sm hover:underline">Clear Filter</a>
						</div>
                    </div>
                </div>
            </div>
            <div class="container px-4 py-4 mx-auto">
				<h3 class="block text-xl text-gray-700 font-semibold mb-3"></h3>
				<div class="flex">
					<div class="w-1/2">
						<div class="rounded-md p-6 bg-white shadow">
							<div class="mb-2 pb-2">
								<h3 class="font-semibold text-lg text-gray-600">Bar Chart</h3>
								<p class="text-sm text-gray-500">Profit Share between customers</p>
							</div>
							<div id="chartdiv" class="w-full" style="height: 240px"></div>
						</div>
					</div>
					<div class="w-1/2 ml-4">
						<div class="rounded-md p-6 bg-white shadow">
							<div class="mb-2 pb-2">
								<h3 class="font-semibold text-lg text-gray-600">Bar Chart</h3>
								<p class="text-sm text-gray-500">Profit Share between customers</p>
							</div>
							<div id="chartdiv2" class="w-full" style="height: 240px"></div>
						</div>
					</div>
				</div>
            </div>
        </div>

		<!-- Resources -->
        <script src="https://www.amcharts.com/lib/4/core.js"></script>
        <script src="https://www.amcharts.com/lib/4/charts.js"></script>
        <script src="https://www.amcharts.com/lib/4/themes/animated.js"></script>

        <script>
			function bar_chart(selector, data) {
				// Themes begin
				// Themes end
				am4core.useTheme(am4themes_animated);

				// Create chart instance
				var chart = am4core.create(selector, am4charts.XYChart);

				// Add data
				chart.data = data;

				// Create axes

				var categoryAxis = chart.xAxes.push(new am4charts.CategoryAxis());
				categoryAxis.dataFields.category = "country";
				categoryAxis.renderer.grid.template.location = 0;
				categoryAxis.renderer.minGridDistance = 30;

				categoryAxis.renderer.labels.template.adapter.add("dy", function (dy, target) {
					if (target.dataItem && target.dataItem.index & 2 == 2) {
						return dy + 25;
					}
					return dy;
				});

				var valueAxis = chart.yAxes.push(new am4charts.ValueAxis());

				// Create series
				var series = chart.series.push(new am4charts.ColumnSeries());
				series.dataFields.valueY = "visits";
				series.dataFields.categoryX = "country";
				series.name = "Visits";
				series.columns.template.tooltipText = "{categoryX}: [bold]{valueY}[/]";
				series.columns.template.fillOpacity = .8;

				var columnTemplate = series.columns.template;
				columnTemplate.strokeWidth = 2;
				columnTemplate.strokeOpacity = 1;
			}

			function radar_chart(selector, data) {
				// Themes begin
				// Themes end
				am4core.useTheme(am4themes_animated);

				// Create chart instance
				var chart = am4core.create(selector, am4charts.RadarChart);


				chart.data = data;

				// Make chart not full circle
				chart.startAngle = -90;
				chart.endAngle = 180;
				chart.innerRadius = am4core.percent(20);

				// Set number format
				chart.numberFormatter.numberFormat = "#.#'%'";

				// Create axes
				var categoryAxis = chart.yAxes.push(new am4charts.CategoryAxis());
				categoryAxis.dataFields.category = "category";
				categoryAxis.renderer.grid.template.location = 0;
				categoryAxis.renderer.grid.template.strokeOpacity = 0;
				categoryAxis.renderer.labels.template.horizontalCenter = "right";
				categoryAxis.renderer.labels.template.fontWeight = 500;
				categoryAxis.renderer.labels.template.adapter.add("fill", function (fill, target) {
					return (target.dataItem.index >= 0) ? chart.colors.getIndex(target.dataItem.index) : fill;
				});
				categoryAxis.renderer.minGridDistance = 10;

				var valueAxis = chart.xAxes.push(new am4charts.ValueAxis());
				valueAxis.renderer.grid.template.strokeOpacity = 0;
				valueAxis.min = 0;
				valueAxis.max = 100;
				valueAxis.strictMinMax = true;

				// Create series
				var series1 = chart.series.push(new am4charts.RadarColumnSeries());
				series1.dataFields.valueX = "full";
				series1.dataFields.categoryY = "category";
				series1.clustered = false;
				series1.columns.template.fill = new am4core.InterfaceColorSet().getFor("alternativeBackground");
				series1.columns.template.fillOpacity = 0.08;
				series1.columns.template.cornerRadiusTopLeft = 20;
				series1.columns.template.strokeWidth = 0;
				series1.columns.template.radarColumn.cornerRadius = 20;

				var series2 = chart.series.push(new am4charts.RadarColumnSeries());
				series2.dataFields.valueX = "value";
				series2.dataFields.categoryY = "category";
				series2.clustered = false;
				series2.columns.template.strokeWidth = 0;
				series2.columns.template.tooltipText = "{category}: [bold]{value}[/]";
				series2.columns.template.radarColumn.cornerRadius = 20;

				series2.columns.template.adapter.add("fill", function (fill, target) {
					return chart.colors.getIndex(target.dataItem.index);
				});

				// Add cursor
				chart.cursor = new am4charts.RadarCursor();
			}

			am4core.ready(function () {
				bar_chart("chartdiv", [{
					"country": "USA",
					"visits": 2025
				}, {
					"country": "China",
					"visits": 1882
				}, {
					"country": "Japan",
					"visits": 1809
				}]);

				radar_chart("chartdiv2", [{
					"category": "Research",
					"value": 80,
					"full": 100
				}, {
					"category": "Human Resources",
					"value": 68,
					"full": 100
				}]);
			}); // end am4core.ready()

        </script>
How to create a Chart Filter with Tailwind CSS?
To create a Chart Filter UI component with Tailwind CSS, follow these steps:
- Create an HTML element to contain your checkboxes. For example:
<div class="flex flex-wrap items-center">
  <!-- checkboxes will go here -->
</div>
- Create a checkbox for each data point you want to filter. For example:
<div class="flex items-center mr-4 mb-2">
  <input type="checkbox" id="data-point-1" class="form-checkbox h-5 w-5 text-blue-600" checked>
  <label for="data-point-1" class="ml-2 text-gray-700">Data Point 1</label>
</div>
Repeat step 2 for each data point you want to filter.
Add an event listener to each checkbox to update the chart when the user selects a checkbox. For example:
const checkboxes = document.querySelectorAll('input[type="checkbox"]');

checkboxes.forEach((checkbox) => {
  checkbox.addEventListener('change', () => {
    // update chart
  });
});
- Style your checkboxes using Tailwind CSS classes. For example:
.form-checkbox {
  border-color: #4a5568;
  border-width: 2px;
}

.form-checkbox:checked {
  background-color: #4299e1;
  border-color: #4299e1;
}
- Customize your Chart Filter UI component to match your design system.
Conclusion
In this article, we explored how to create a Chart Filter UI component using Tailwind CSS. We learned that Tailwind CSS is an excellent choice for creating UI components because it allows you to quickly style your HTML elements without writing any CSS. We also learned that the Chart Filter UI component is essential for data visualization, as it allows users to focus on specific data points. By following the steps outlined in this article, you can create a Chart Filter UI component that matches your design system.